Randomized experiments (i.e. A/B tests, RCTs) are great. A simple treatment vs. control experiment where all units have the same probability of assignment to treatment ensures that receiving treatment treatment is not systematically correlated with any observed or unobserved characteristics of the experimental units. There will be differences in, e.g., mean covariates between treatment and control, but these are already accounted for in standard statistical inference about the effects of the treatment.
However, things can go wrong in randomization. Often this is understandable as some version of latent noncompliance or attrition. Some units get assigned to treatment, but something downstream overrides that and the original assignment is lost (a kind of latent noncompliance). Or maybe when that mismatch is detected, something downstream drops those observations from the data. Or maybe treatment causes units (e.g., users of an app) to exit immediately (e.g., the app crashes) and that unit isn’t logged as having been exposed to the experiment.
So it is good to check that some key summaries of the assignments are not extremely implausible under the assumed randomization. For example, we may do a joint test for differences in pre-treatment covariates. Or — and this is particularly useful when we lack any or many covariates — we can just test that the number of units in each treatment is consistent with our planned (e.g., Bernoulli(1/2)) randomization; in the tech industry, this is is sometimes called a “sample ratio mismatch” (SRM) test.
These kinds of problems are quite common. One very common way they happen arises from the streaming arrival of randomization units to the point where treatment is applied. In cases where users aren’t logged in, this is unavoidable. In cases where there is a universe of user accounts, it can still be a dead end to randomize them all to treatments and use that as the analytical sample: most of these users would never have touched the part of the service where the treatment is applied. So instead it is common to trigger logging of exposure to the experiment and just analyze that sample of users (which might be less than 1% of all users); use of this kind of “triggering” or exposure logging is very common, but also can present these problems. For example, an analysis of experiments across several products at Microsoft found that around 6% of such experiments had sample ratio mismatches (at p<0.0005).
Here’s another example of randomization problems — with public data.
Upworthy Research Archive
Nathan Matias, Kevin Munger, Marianne Aubin Le Quere, and Charles Ebersole worked with Upworthy to curate and release a data set of over 15,000 experiments, with a total of over 150,000 treatments. Each of these experiments modifies the headline or image associated with an article on Upworthy, as displayed when viewing a different focal article; the outcome is then clicks on these headlines. You may recall Upworthy as a key innovator in “clickbait” and especially clickbait with a particular ideological tilt.
One of the things I really like about how they released this data is that they initially made only a subset of the experiments available as an exploratory data set. This allowed researchers to do initial analyses of that data and then preregister analyses and/or predictions for the remaining data. To me this helpfully highlighted that sometimes the best way to provide a data set as a public good isn’t to provide it all at once, but to structure how it is released.
Randomization problems
There were some problems with the randomization to treatments in the released data. In particular, Garrett Johnson pointed out to me that many times there were too many or too few viewers assigned to one of the treatments (i.e. SRMs). In 2021, I followed up on this some more. (The analysis below is based on the 4,869 experiments in the exploratory data set with at least 1,000 observations.)
If you do a chi-squared test of the proportion in each treatment, you get a p-value distribution that looks like this once you zoom in on the interesting part:
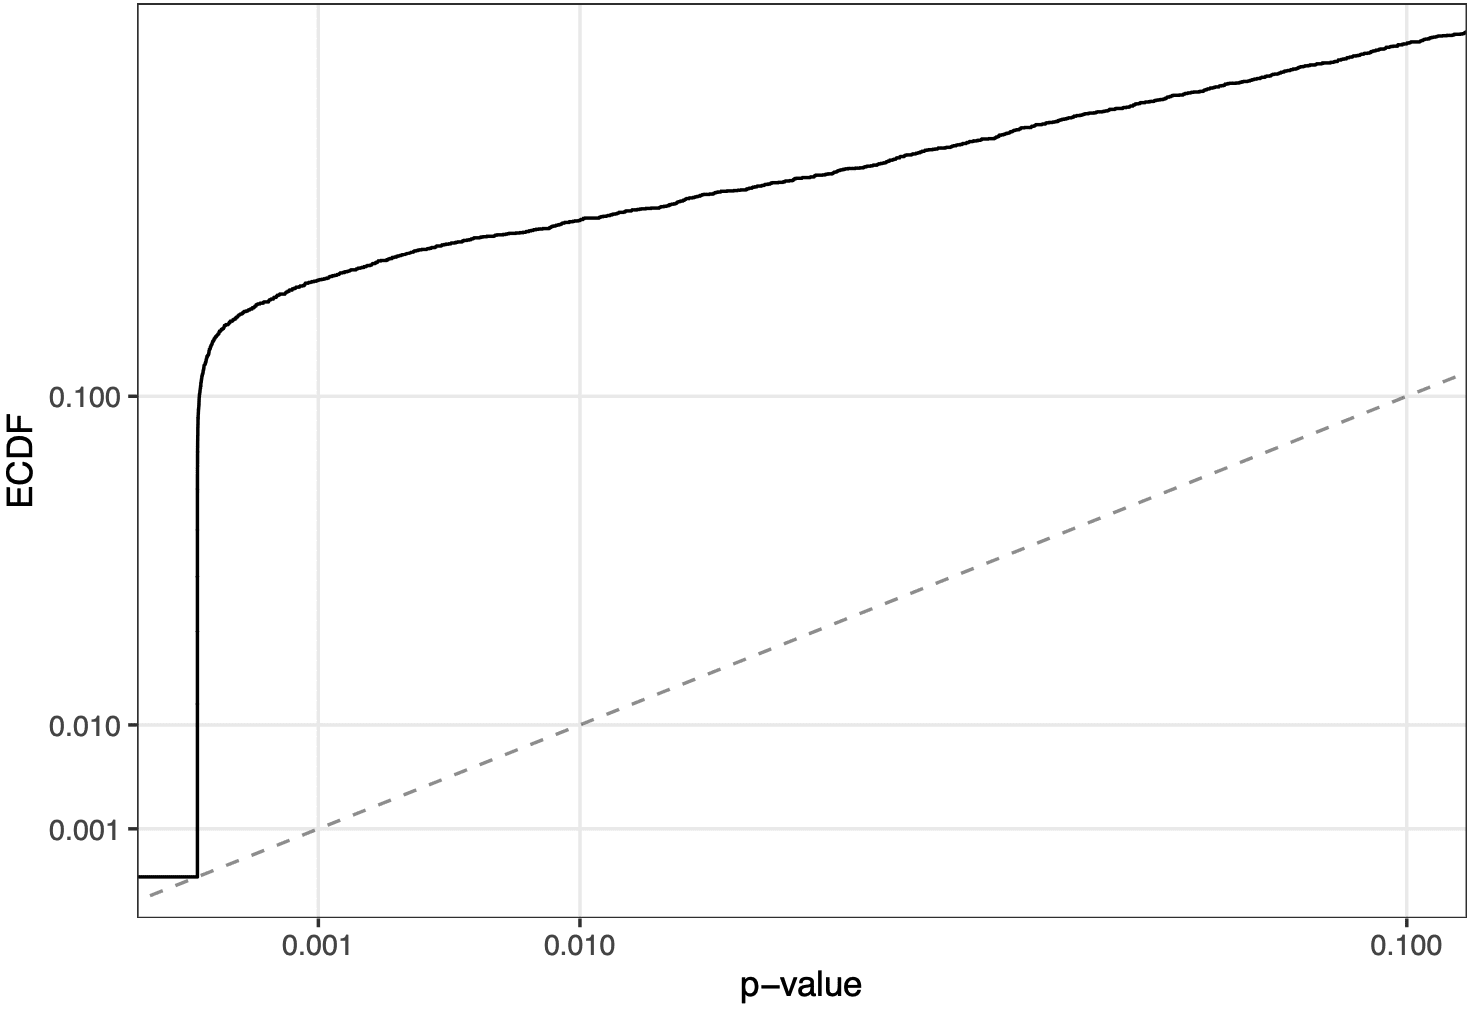
That is, there are way too many tiny p-values compared with the uniform distribution — or, more practically, there are lots of experiments that don’t seem to have the right number of observations in each condition. Some further analyses suggested that these “bad” SRM experiments were especially common for experiments created in a particular period:
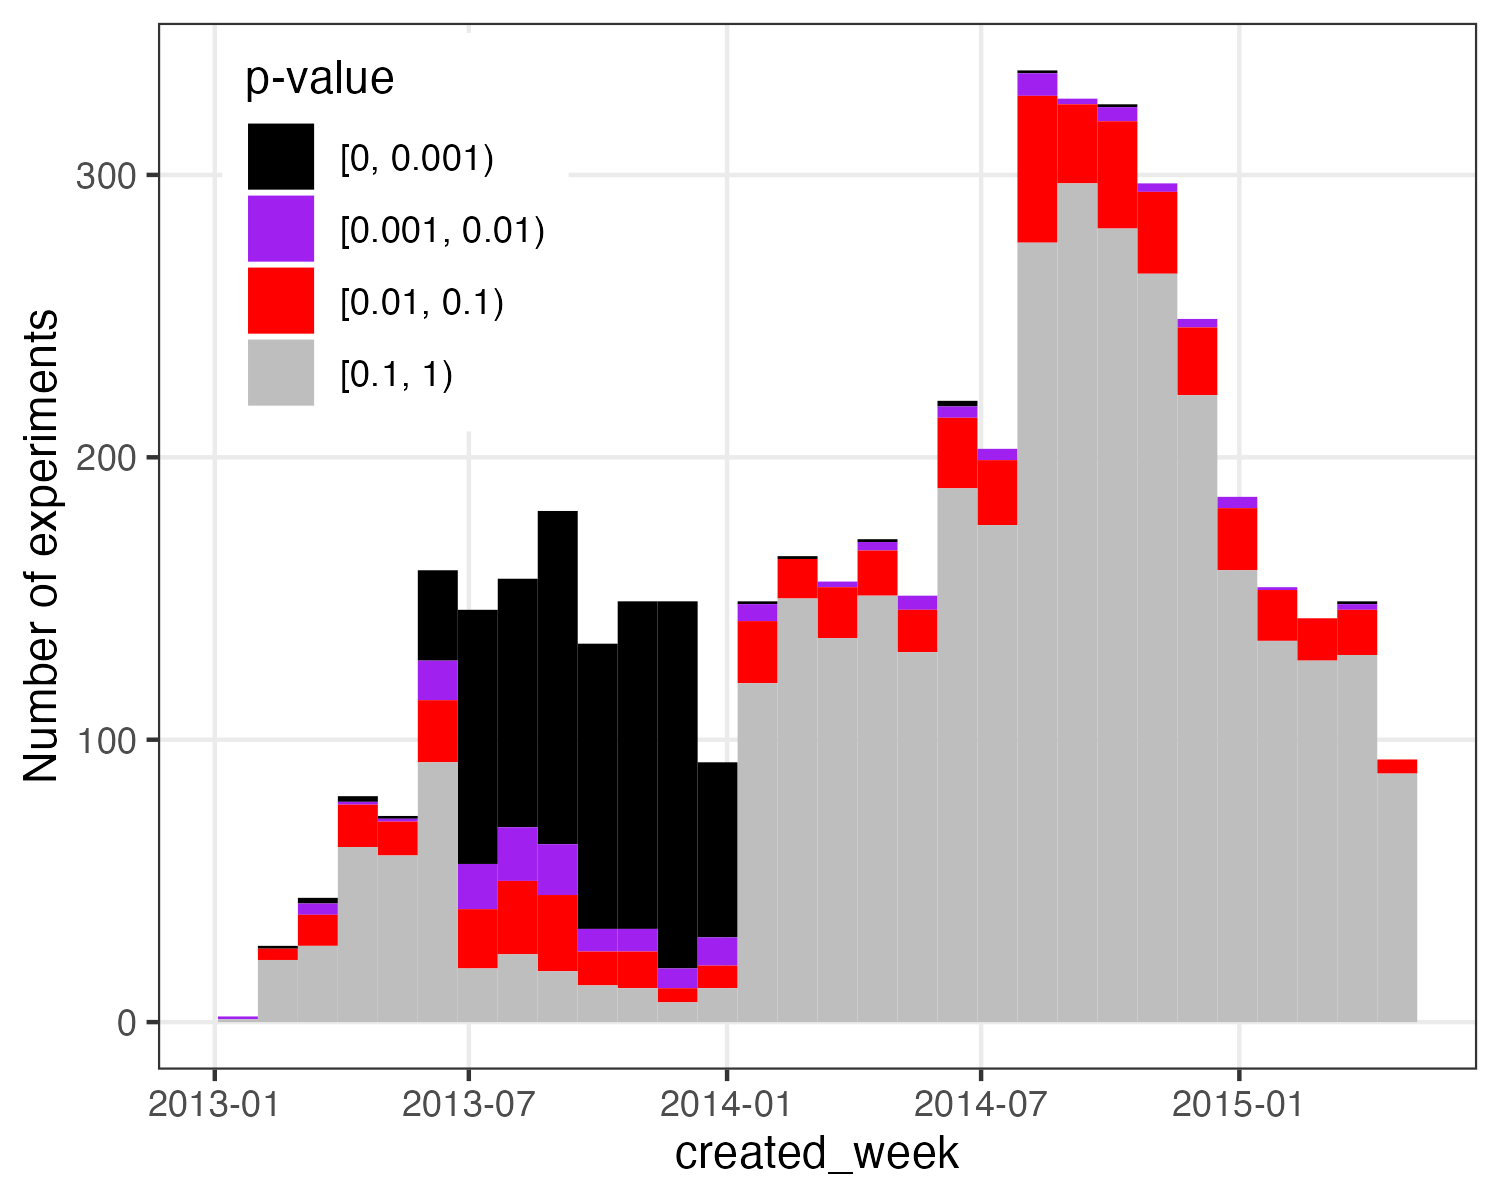
But it was hard to say much about why that was.
So in 2022 I contacted Nathan Matias and Kevin Munger. They took this quite seriously, but also — because they had not conducted these experiments or built the tooling with which they were conducted — it was difficult for them to investigate the problem.
Well last week they have publicly released the results of their investigation. They hypothesize that this problem was caused by some caching, whereby subsequent visitors to a particular focal article page might be shown the same treatment headlines for other articles. This would create an odd kind of autocorrelated randomization. Perhaps point estimates could still be unbiased and consistent, but inference based on assuming independent randomization could be wrong.
I hadn’t personally encountered this kind of caching issue before in an experiment I’ve examined. Other caching issues can crop up, such as where a new treatment will have more cache misses, potentially slowing things down enough that some logging doesn’t happen. So this is perhaps a useful addition to a menagerie of randomization devils. (Some of these issues are discussed in this paper and others.)
They identify a particular period where this problem is concentrated: June 25, 2013 to January 10, 2014.
In advance of their announcement, Nathan and colleagues contacted the several teams who have published research using this amazing collection of experiments. Excluding the data from the period (making up 22% of the experiments) with this particularly acute excess of SRMs, these teams generally didn’t have their core results change all that much, so that’s nice.
Remaining problems?
I looked back at the full data set of experiments. Looking outside of the period where the problem is concentrated, there are still too many SRMs. 113 of the experiments outside this period have SRM p-values < 0.001. That’s 0.45% with a 95% confidence interval of [0.37%, 0.54%], so this is clearly an excess of such imbalanced experiments (compared with an expected 0.1% under the null) — even if much, much fewer than in the bad period (when this value is ~2/3). The problem is worse before, rather than after, the acute period, which makes sense if the team fixed a root cause:
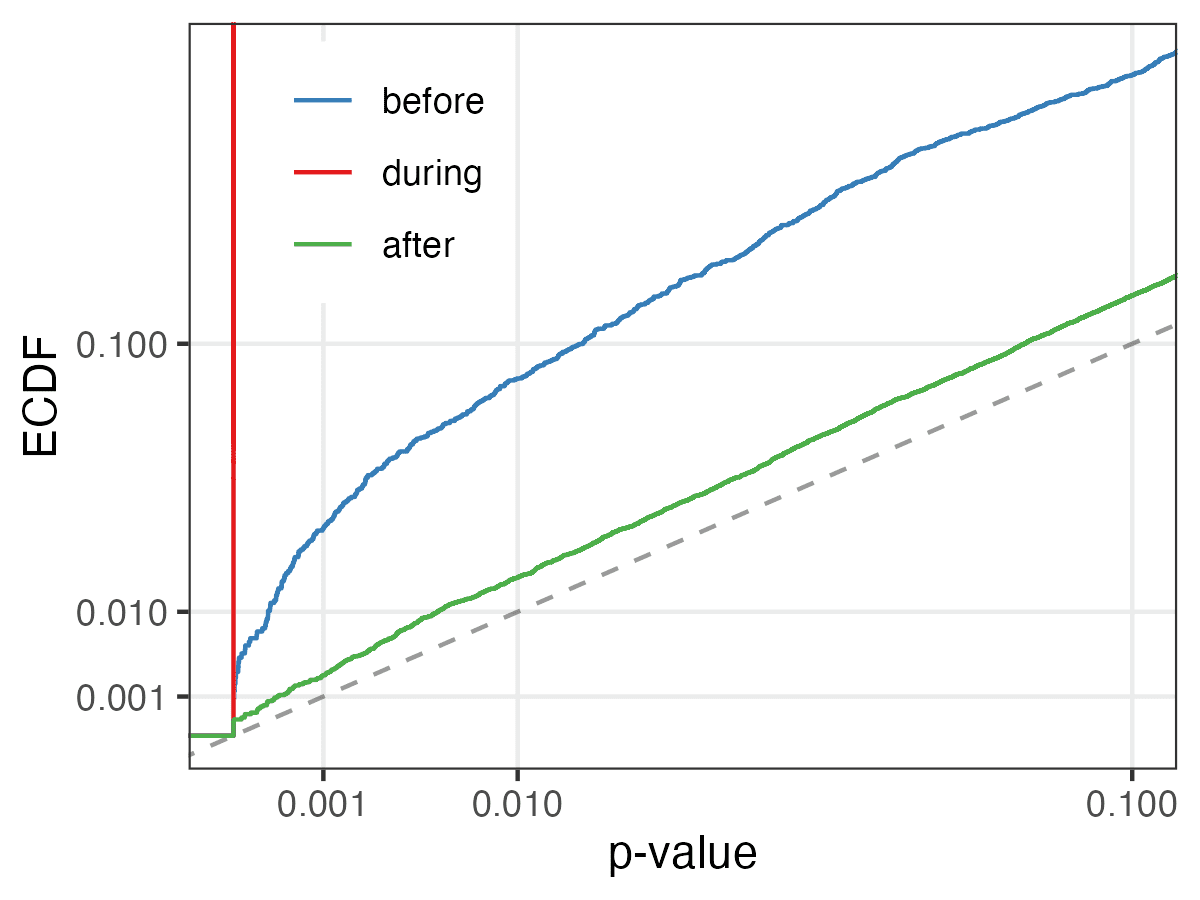
If there are only around a half of a percent of the remaining experiments with problems, likely many uses of this data are unaffected. After all, removing 22% of the experiments didn’t have big effects on conclusions of other work. However, of course we don’t necessarily know we have power to detect all violations of the null hypothesis of successful randomization — including some that could invalidate the results of that experiment. But, overall, compared with not having done these tests, I think on balance we perhaps have more reason to be confident in the remaining experiments — especially those after the acute period.
I hope this is an interesting case study that further illustrates how pervasive and troublesome randomization problems can be. And I may have another example coming soon.
[This post is by Dean Eckles. Because this post discusses practices in the Internet industry, I note that my disclosures include related financial interests and that I’ve been involved in designing and building some of those experimentation systems.]
“ A simple treatment vs. control experiment where all units have the same probability of assignment to treatment ensures that receiving treatment treatment is not systematically correlated with any observed or unobserved characteristics of the experimental units.”
So do some other non randomized treatment assignment strategies. Some of those non-randomized strategies will also not give you a high probability of generating a very suboptimal or even poor design. Why do you think randomization is so ‘great’?
I suspect that those “other non randomized treatment assignment strategies” may actually be randomized – if they indeed guarantee the absence of systematic correlations.
Depending on what you mean by systematic correlations (and if this is some sort of large sample property, I’d ask why do you care so much what happens in the limit?), this does not seem to be a true statement.
Suppose that I have n=4 experimental units and all I can know about them is that some covariate is measured to be A, B, A, B.
Neither of us would randomly assign treatments on these 4 experimental units. We’d assign treatments so one of the As is treated, one is control and one of the Bs is treated one is control. Fine. You might use a random number generator to choose which A. But it isn’t that randomization that is making the treatment uncorrelated with the covariate… how could it?
So you might be trying to argue that my not using a random number generator is still random since from my perspective the two As are exchangeable.
But the point is randomization is not what is making the experiment good. And making a fuss about randomization leads less thoughtful people to think it is ok to just go ahead and randomly assign treatments across all 4 units and end up with both As treated and both Bs control a fair amount of time.
> You might use a random number generator to choose which A.
How are you proposing that the choice is made – if not at random?
There’s a rule of thumb: “Block what you can, randomize what you cannot.” https://www.itl.nist.gov/div898/handbook/pri/section3/pri332.htm
There are a bunch of reasons why blocking may not be appealing in practice, such as not having any very predictive covariates prior to randomization and also that units are streaming in, so you don’t even know how many units with each covariate profile you’ll have, cf. https://arxiv.org/abs/2309.08808.
Anyway, totally agreed that in many cases, unconditional randomization isn’t the best choice but that a blocked/stratified design is better.
Just a quick comment that I prefer summarizing using z-scores rather than p-values. The p-value transformation has lots of of nonintuitive properties, whereas the z-score is (for me) much easier to interpret.
I agree sometimes z-scores are better. Here, because there are often more than two conditions, I did a chi-squared test, so I guess I could have done some kind of transformation to get a half-normal distribution under the null.
But also working with p-values makes some of what we’re doing here very clear, since for any given threshold on p-values, we know what fraction should be below that in expectation under the null, as in “113 of the experiments outside this period have SRM p-values < 0.001. That’s 0.45% with a 95% confidence interval of [0.37%, 0.54%], so this is clearly an excess of such imbalanced experiments (compared with an expected 0.1% under the null)". No additional transformations needed.
Dean:
Another problem that sometimes comes up that I don’t think you mentioned in your post (but maybe I missed it; it’s a long post!) is that the mix of people entering the experiment can change over time. This does not affect the randomization balance, but it affects what is being estimated, if the treatment effect varies by person and over time.
For example, suppose that the participant mix is such that frequent customers enter the experiment sooner, and further suppose that they are more affected by the treatment. Then your expected treatment estimate will be larger at the beginning of the experiment. This could be important on its own (in that you might want to untangle interactions with participants and with time) and also introduce bias if there are randomization problems as discussed in your above post.
This change of who is entering the experiment can be a big problem when experimenters do indeed change the treatment probability over time. This could be handled by IPW estimators. But often it is better to instead fix the relative probabilities of the conditions in a given experiment and allow experimenters to either (a) change the size of the experiment or (b) easily run iterative experiments. In fact, in practice both can make sense, where people use (a) in the very early ramp-up of an experiment as they become confident there aren’t quality assurance issues and use (b) over a longer time scale. We discuss some of this in Section 5.2.2 of https://dl.acm.org/doi/10.1145/2566486.2567967.
On your second point, yes, that is often exactly what happens. This is quite important and leads to distinguishing factors like true “novelty effects” from those other factors. One can decompose treatment effects by cohorts defined by the day people were first exposed to the experiment and the number of days since then. This can lead to some interesting kind of age-period-cohort issues, but with treatment effects, something we’re working on a bit.