This post is by Phil Price, not Andrew.
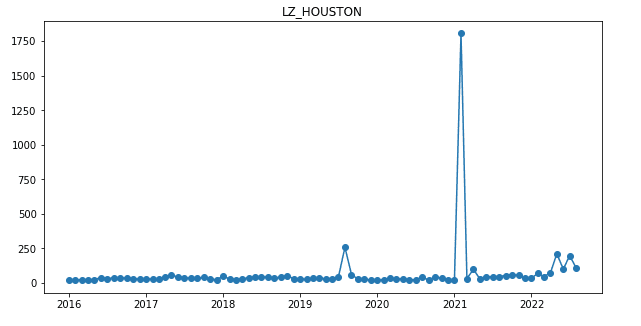
I have a client company that owns refrigerated warehouses around the world. A refrigerated warehouse is a Costco-sized building that is kept very cold; 0 F is a common setting in the U.S. (I should ask what they do in Europe). As you might expect, they have an enormous electric bill — the company as a whole spends around a billion dollars per year on electricity — so they are very interested in the cost of electricity. One decision they have to make is: how much electricity, if any, should they purchase in advance? The alternative to purchasing in advance is paying the “real-time” electricity price. On average, if you buy in advance you pay a premium…but you greatly reduce the risk of something crazy happening. What do I mean by ‘crazy’? Take a look at the figure below. This is the monthly-average price per Megawatt-hour (MWh) for electricity purchased during the peak period (weekday afternoons and evenings) in the area around Houston, Texas. That big spike in February 2021 is an ice storm that froze a bunch of wind turbines and also froze gas pipelines — and brought down some transmission lines, I think — thus leading to extremely high electricity prices. And this plot understates things, in a way, by averaging over a month: there were a couple of weeks of fairly normal prices that month, and a few days when the price was over $6000/MWh.
If you buy a lot of electricity, a month when it costs 20x as much as you expected can cause havoc with your budget and your profits. One way to avoid that is to buy in advance: a year ahead of time, or even a month ahead of time, you could have bought your February 2021 electricity for only a bit more than electricity typically costs in Texas in February. But events that extreme are very rare — indeed I think this is the most extreme spike on record in the whole country in at least the past thirty years — so maybe it’s not worth paying the premium that would be involved if you buy in advance, month after month and year after year, for all of your facilities in the U.S. and Europe. To decide how much electricity to buy in advance (if any) you need at least a general understanding of quite a few issues: how much electricity do you expect to need next month, or in six months, or in a year; how much will it cost to buy in advance; how much is it likely to cost if you just wait and buy it at the time-of-use rate; what’s the chance that something crazy will happen, and, if it does, how crazy will the price be; and so on.
In this post I’m not going to go into the details of the decision analysis about how much electricity to buy in advance. All of the above is an explanation of why I find myself trying to model electricity prices. And I’m not even going to get into my current price model in detail: really all I want to do is to motivate a general discussion of time series models, and why I am, somehow, skeptical about their ability to do even a half-decent job but also convinced that they are indispensable for some purposes.
For this discussion it will be helpful to look at a different time series of electricity prices that is…well, I’m tempted to say “closer to what we expect”, but that would imply that the Texas event is not something we expect, whereas it’s more accurate to say that we do expect events that extreme but only very, very rarely. In the parlance popularized by Taleb we might call that Texas event a “black swan” — it’s something a facility’s energy manager might never face in their whole career — whereas there are smaller spikes that are still extremely consequential to electricity buyers and that are much more frequent. So let’s look at a time series that is more typical. The figure below shows monthly-average peak-period electricity prices in Southern California.

The y-axis doesn’t start at zero, I just noticed and I apologize but I’m not going to remake and re-import the figure.
Like a lot of time series that capture all sorts of phenomena, this one has some obvious features. There’s an annual pattern of low prices in the first few months of the year and higher prices in the summer; a regular repeating pattern is called ‘seasonality’ in the time series biz, no matter what the periodicity is. There’s an upward trend starting in maybe mid-2020 or so. There appears to be more ‘random’ variability — more month-to-month variation, at any rate — starting sometime in late 2020 or early 2021 than there was earlier. And it appears that at almost any time of year there’s a chance of a spike that lasts one or two or three months.
This time series really shows the futility of trying to use a time series approach on its own to forecast electricity prices. If you only had the data from 2016 through 2020, there’s really no way you’d predict what would happen over the next couple of years. I mean, sure, you could make some sort of contrived model that would generate a plot like that but you’d have to put your thumb on the scale…and push hard, too. Those one- or two-month summer peaks are largely driven by weather: in a few recent years the state has experienced some record-setting heat waves, prompting people to use a lot of electricity for air conditioning so that power companies are forced to operate their most expensive power plants more than they usually do. Good luck forecasting those heat waves a year or two in the future. And then in the past year there has been a big increase in prices due to the shutdown of Russian natural gas imports to Europe, coupled with general inflation and a couple of other significant factors (like the shutdown of a lot of French nuclear production due to the need for unanticipated repairs). If you saw that coming back in 2020, bully for you!
The bottom line is: forecasts of electricity prices suck and they are going to keep sucking.
And yet: my client needs forecasts. Actually my client doesn’t need a forecast of the electricity price so much as they need a statistical distribution of what the price might be. (It is also possible to write their storage contracts so they can pass electricity prices through to their customers, an issue I won’t go into here but I will say that it does not eliminate the need for some people to have forecasts of price distributions).
So: people need forecasts of the statistical distribution of future electricity prices. Those forecasts will be based on historical prices and on any additional predictive variables you might have available (such as the price of natural gas futures, or the planned number of megawatts of solar generating capacity that will be installed in a given region in the next year, or whatever else you’ve got). The central values of those forecasts are going to be pretty bad, at least if you’re forecasting many months out, but “pretty bad” is not the same as “useless” and anyway you just have to do the best you can.
In the past I have used canned models like SARIMAX and GARCH for applications like this but I have not been entirely happy with them, and have sometimes been very unhappy. I don’t want to overgeneralize — perhaps one or more of the many flavors of GARCH would be OK — so I emphasize that I’m characterizing my own experience with the models rather than making assertions about the entire class of available time series models. My experience has been rather negative for a variety of reasons, two of the biggest ones being (a) models that don’t adapt to changing behavior at the appropriate rate, and (b) models that don’t capture the uncertainties well even if they do kinda-sorta OK with the central estimates.
My current approach is a hidden variables model (I think technically it meets the criteria for being a ‘state space model’) that includes month effects, trend, and ‘noise’, all of which can change with time. For instance, the ‘July effect’ for this year is drawn from a distribution centered on the July effect for last year, but with a distribution whose width is determined by the model fit, so this year’s July effect can differ from last year’s. The trend this month is drawn from a distribution centered on the weighted average of the trend over several previous months, but will generally differ from it. And so on. The model is implemented in Stan and behaves reasonably, although I wish it were faster: it takes several minutes to run enough chains long enough to get good convergence.
One thing my current model does not handle well is really crazy spikes like February in Texas. It’s possible that I could fine-tune some extremely long-tailed distribution for the ‘noise’ part of my model in such a way that it almost always generates a small value but on very rare occasions generates a really big one, such that points like that don’t have an outsize effect on future forecasts, but I haven’t even tried that approach yet. It doesn’t sound very promising, although I may be wrong. My preferred way to put things like that into the model would be to fit a mixture model, with maybe a 0.2% chance that any given month gets a price from an extremely wide distribution, while 99.2% of the time the distribution is not so wide. I can follow the model for mixture models in the Stan manual and I suppose I will give that a try.
I hope that someone will someday write a more general Stan time series model that I can use off the shelf. It’ll include multiple seasonality (e.g. month effects and quarterly effects, or such) that can themselves vary with time; trend that can vary with time; will allow GARCH-like variability in noise; and will allow a multi-component mixture of noise components. I am a good bit of the way towards having such a thing myself, but one thing that is guaranteed when I write a model is that it will not be done in a very computationally efficient way.
I’m putting this out there for comment and critique. I’d be happy to hear about your experience with time series modeling, and thoughts or insights that might help me or other people do a better job at it. But I’m also aware that there’s only so much that can be done: as I said, no model based on data that looked like the above plot through the end of 2020 would have done a good job at predicting the past couple of years.
This post is by Phil.
Oooh, I hate those y-axes that go below zero for all-nonnegative data! It makes it really difficult to see potentially important differences near the zero end of the scale.
Now, someone might reply that it would be better to just use the log scale, and I might agree with that, but I understand that the log scale can add communication difficulties, so I see the appeal of keeping the graph on the original scale. But having the y-axis at zero: that change is free, and I’d argue that it can only improve communication here.
Regarding the general time-series model for Stan: Have you tried Prophet, which is a time series package that fits its models using Stan? Prophet is not completely general but I’d think it would be a natural first step. Also, if you have new models you want to fit, perhaps other people would like to fit those models too, and maybe the Prophet team would be interested in adding them.
A hater’s gonna hate, whaddyagonnado.
I still don’t have a nice set of default settings for matplotlib plots like I do for ggplot. I guess I should pay more attention to that. But…well, hey, hate what you want to hate, who am I to tell you otherwise, but in these specific instances I don’t have a ton of sympathy. That first plot is hardly going to change at all if I set the bottom axis limit to zero, so who cares. And the second one..well, I already apologized for not setting the bottom limit to zero, but on the other hand the monthly mean cost has a realistic lower limit of something like $15/MWh so one could argue that there’s no point filling up a bunch of the plot with white space.
So: I appreciate your criticism and the next time I make one of these I will at least draw a horizontal line at 0, that really is free. But talk about making a mountain out of a molehill.
You can keep your ggplot defaults in python if you use plotnine: https://plotnine.readthedocs.io/
As for Prophet, I haven’t tried it but I’ve read about it, and seen some discussions of how it works on specific datasets, and there are several things I don’t like about it for my application. I suppose I could try it and see, maybe it’ll work better than I think it will. Or I could put the time that I would spend doing that into doing other improvements to my model. Sometimes it’s hard to know the best way forward.
For what it’s worth, one of the creators of Prophet, Sean Taylor, has recommended people use Orbit instead. Orbit _might_ better fit your domain, though it isn’t obvious to me that it is well-tuned to extreme events either.
https://twitter.com/seanjtaylor/status/1321216538678972418?s=20&t=fvj1aT84GIt0BxTrNDX-8w
Oh goody, this is just the sort of thing I was hoping for when I wrote this post. I will definitely take a look, thanks.
Texan here. The electricity price spike that happened here in February absolutely cannot happen anywhere else. Texas runs its own highly regulated electricity market with a sham “free market pricing” approach that encourages price spikes like that under extreme conditions. A company that uses electricity like your client should avoid Texas if at all possible. If not, the most cost-effective solution is probably to buy off some state legislators to protect them from the stupidity of our “market”. Although they will probably want to check to see if some other big businesses have already done it.
Yes. And even Texas has now decreased the maximum that can be charged. But as far as I know they still are not increasing the requirements for power suppliers to harden their infrastructure (although I could be wrong about this; it was true the last time I checked, a few months ago). The Texas power grid has always relied on the magic of markets to ensure that the grid would always operate. If other wind turbine operators aren’t ice-proofing their turbines you can spend the money to ice-proof yours, and then when the rare ice storm happens you’ll be able to charge a fortune for your power, thus making it worth the extra cost that you have incurred. If nobody else is hardening their natural gas infrastructure against an ice storm, you can do it to yours and you’ll be the only one with gas to sell when the event happens, so you’ll make back your investment and more. Surely there is no reason for the government to get involved. Government regulation is evil and must be avoided! Indeed, Rick Perry wrote “Texans would be without electricity for longer than three days to keep the federal government out of their business.” (I wonder if the Texans in question included the friends and families of the 250+ people who died due to the blackouts?).
If it is still the case that Texas reduced the maximum that can be charged for power, but did not impose new requirements on grid robustness, then they have made it more rather than less likely that there will be more examples of severe problems in the future: the incentive to harden the grid is lower.
But my client wouldn’t want to abandon Texas…not out of principle but because there’s money to be made there just like everywhere else. Texans, too, buy frozen turkeys and ice cream and TV dinners (is that even a thing anymore?) and all manner of other frozen foods. But my client definitely does need to take the potential for these sorts of price spikes into account, which is why they hired four of us to build a software tool to help with the decision making.
And even though other markets aren’t as nutty as Texas, they can still be pretty nutty. Electricity in Germany cost an average of E35 per MWh in August 2020; two years later it cost E470. OK, that’s only a factor of 15, not 50 as happened in Texas, but it’s still enough to hurt. And it’s not like that’s the worst it could have been. I assume there’s a regulatory limit there too, but I doubt they were close to it.
Anyway thanks for pointing out that Texas has the potential to be especially crazy on this, and that they have exercised that potential in the past.
The trick with electricity prices is that certain consumers will pay essentially any amount to keep the lights on, so you really need one model for prices under normal conditions and a separate model of supply shortfalls. Then you plug that market’s price ceiling into the second model.
I did this for years, and I’m glad to be done with it. I’ll send Andrew the documentation of my old model (ca. 2011, and for New York, not ERCOT, fwiw) and he can forward it to you
Oh, terrific, thank you J(ao)!
My client is in markets all over the US and Europe so a NY-specific model would be helpful even if it doesn’t generalize, but I expect it will. I will take a look and see if there’s anything in it that I should add to mine. I’ll get in touch with you directly (if Andrew forwards your contact info) if I find something useful or insightful, at the very least you should get credit for it but maybe more than that. Anyway it’ll be very interesting to see your approach.
Cool post!
A question regarding the state space model that you described. I understand that some models in this class have more “realistic” components, like not assuming deterministic trends, or seasonality, etc.
But in your case did it actually generated superior forecasts? If you select a period for evaluation (controlling the estimation sample for maintaining the forecast horizon) does it actually generate smaller errors on average than say the other simpler methods?
I really like state space models for time series, but I wonder if the ability to capture more “sophisticated ” types of variation in-sample actually leads to better out-of-sample forecasts
“I really like state space models for time series, but I wonder if the ability to capture more “sophisticated ” types of variation in-sample actually leads to better out-of-sample forecasts”, yeah, that’s a great question and I’m sure the answer depends on the specific data and model. In principle you _should_ be able to get better forecasts, but in practice your sophisticated model is going to involve a lot of assumptions that aren’t fully testable so it’s really hard to know how well you will do.
But at least you can include phenomena that you know should be in the model. One of my frustrations with the more standard models I’ve tried is that they include assumptions that are obviously wrong. The assumptions in my own model are wrong too, of course, but they’re not _obviously_ wrong. Somehow that is easier for me to stomach even if it doesn’t necessarily lead to better forecasts.
Can your client just not buy electricity during short-duration spikes? I know that sounds facetous, but I was reading a while ago about a proposal to use large cold storage facilities as “batteries” for renewable power — when there’s plenty of power, cool them down below usual operating temperature, and when there’s a shortage of power, allow them to warm back up to 0F (or whatever). Clearly, this wouldn’t work for a months-long increase in price, but for a short-duration-extreme-weather-event-that-was-predicted-a-few-days-in-advance it might work?
No no, it doesn’t sound facetious at all, it’s a great question. It is indeed standard practice in the industry to try to coast through high-price periods when they can. It’s not just this industry: deliberately varying one’s demand in response to price signals or other signals is called “demand response” and it’s widespread. And yeah, these are huge facilities with enormous thermal mass. If you do a little bit of pre-cooling — e.g. if you spend a few hours prior to the peak pricing period with the chillers trying to bring the temperature down to -2F instead of the usual 0F — then when you shut off the chillers the indoor air temperature starts climbing in something like an asymptotic approach to 0F, because all of the tons of food in the facility are still at around 0. That’s important because the facilities are contractually obligated to keep the temperature at or below a specified level. (I’ve used 0F here as an example, and it’s a standard temperature, but different facilities or different rooms in a single facility can have different temperatures). So, not a silly question at all, and this is a routine thing to do to get through short-duration peaks if you can guess they are coming, e.g. if there’s a forecast for very high afternoon temperatures, which often lead to a high real-time electricity price.
SARIMAX lets you put in exogenous variables, right? One approach would be to make an exogenous variable called “heating demand,” which is the number of hours a region spends under, say, 50 degrees. There are various gridded climate datasets you can use for that. That would still not help with Texas, which had a very nonlinear response at the point where the ground froze up enough to make natural gas wells stop producing. Another useful variable might be the price of natural gas, which wouldn’t help with spikes, but could help you identify a floor which electricity prices won’t fall below.
Yes, good point! There’s useful information in the price of natural gas advance orders, as well as options and futures (which can tell you about tail risk and not just the market’s forecast of the mean value of the distribution). There are even electricity futures, although in most regions these are very thinly traded and don’t appear to do a good job at providing a real assessment of ‘tail risk’, although this might change in the future. Unfortunately even when you use all this information the forecasts can still be very wrong. But somewhat less wrong, and that’s better than nothing. It’s a complicated world!
I really say, I can’t agree more about the sentiment that ‘this is impossible but we need to do it anyway’. I’m the author of a package called AutoTS, give it a look a post thoughts on GitHub discussions if you have them. Most models try to predict a central tendency which means they don’t predict semi-anomalous spikes very well. Motif models are my best solution so far, as well as an elaborate linear model called Cassandra. Also as per another reviewer, don’t be afraid of Prophet. It isn’t perfect but it is consistently at least okay, a rare model trait.
Thanks, I will look at AutoTS and Cassandra…and Prophet and Orbit too.
It’s hard to know how much time I should spend looking at existing models vs working on my own.
Hey Phil,
I really think the models you want are ones that take weather variability and market demands for frozen foods into account, and then electricity consumption is a function of the weather and activity, and some other stuff.
Part of that is just “seasonal” which I’ll define as truly periodic component with period 1yr, but there’s also other stuff, like for example CA wildfire seasons could have been predicted several years in advance. Maybe not exactly which year they’d be bad, but in 2015 you could have predicted that some time between 2016 and 2030 there would be some extreme weather events which caused major fires and threatened electricity production. That far out you might not be able to use it to decide which exact years to buy electricity futures in but you could use it to predict that there would be a major shortage of electricity and so buying futures contracts every year in this 15 year range would probably be worth it by paying out in the extreme cases…
Why? Because we just know something about the long term trends in fuel accumulation, climate change, drying out of the west, and that money wasn’t being put into maintaining transmission lines at the level sufficient to prevent sparking wildfires etc. There’s just a lot of stuff we knew was going on.
Texas, sounds like the same thing. Sure you didn’t now which year would have the crazy breakdown, but you knew that Texas was playing with fire… it’d be worth it to hedge against one of these events because such an event was inevitable.
Unfortunately, this probably means you need to be a bit of an expert in every region on the climate, energy production, and political issues going on there. Still, for potentially billions in losses, it’s probably worth it.
instead of building time-series models based on historical time series and extrapolating those to the future, the approach I’m thinking of is to build causal models of processes, and then figuring out what long-term patterns of behavior are likely under these causal models. The same thing is true for example of figuring out tsunami risk in Japan, or soil liquefaction risk at dams around CA, or flooding or drying risk in the Mississippi river basin, or Hurricane and flood risk in Florida or Excess snow risk in upstate NY… We have historical based models in Civil Engineering, and these are honestly poor. People believe somehow that understanding “fancy statistics” lets them get away from understanding causal processes.
Hi, Daniel, do you have any resourse to suggest about these “causal models of processes”? thanks
Hi Marco, just saw your post.
Here’s a paper I wrote with my wife on causality agent based models of limb formation in mouse embryos
https://elifesciences.org/articles/29144
More generally you might want to look at books like wilenskys book using netlogo isbn 0262731894
Or Railsback isbn 0691136742
Or for non agent based approaches something like Fowlers “mathematical modeling in applied sciences” or Howison, “practical applied mathematics” or Barenblatt “Scaling”
A lot of the examples will come from physics oriented topics, but there is a lot of stuff that could be done when it comes to something like electricity markets beyond just “the future will look like the past”
Daniel,
“buying futures contracts every year in this 15 year range would probably be worth it”, well, therein lies the rub: surely this depends on how much it costs to buy in advance? It can’t really be the case that no matter how much it costs, it’s worth it.
But this connects to another issue: there are people who do energy trading for a living, just as there are people who do stock trading for a living. We don’t expect to be able to beat those people, since they do indeed know the vagaries of the market and the risk in each region. Perhaps my client should just pay a few of these people to draw some statistical distributions on the back of an envelope once a month: what do you think the distribution of possible prices is in 1, 6, 12, 18, 24 months? As it stands, we do use the market price of future energy purchases as one of the inputs to our model. But, you may ask, why not just take the market price for future energy as _the_ forecast for that month, or at least for the mean of the distribution? Well, we kinda do…except that we believe there is a premium and that the premium depends on the tail risk. If everyone knew for sure that the cost of electricity in two years would be $60/MWh, you’d be able to buy it now and indeed you could pay a bit less than $60/MWh because you’d basically be loaning someone money for a couple of years. But if the market thinks OK, probably will be around $20 but could be $100 if such-and-such happens, which ‘the market’ collectively thinks has a 1/6 chance of actually happening, then the mean is only $50/MWh but you’re going to have to pay a premium to induce sellers to take the risk of losing $50/MWh for each MWh they sell you, so maybe the cost to buy in advance is $60/MWh in this case too. So you can get the same price two different ways: low uncertainty, or a low likely cost but a chance of a much higher cost. We really want to know the tail risk and the price alone doesn’t tell you that. This is where a robust options market in electricity would really help — people who really understand the risks in a specific region would sell the option to buy in the future at $50, $60, $70, etc., and this would map out a probability distribution. There is a nascent market like that but it is extremely thin and even a cursory look at the data makes it obvious that it does not in fact characterize the risks well at all. Maybe someday.
Yes, the biggest issue with these tail issues is that there is clearly a kind of moral hazard that people exhibit because the government steps in during extreme events. For example flooding in New Orleans. Is it possible to make money by banking up disaster relief equipment etc and waiting for a bad event and then showing up with your needed supplies and selling them at high prices? No, because govt will seize your assets and put you in jail for “price gouging”… Or may do so.
Similarly, if you set up a big money making financial scheme regarding mortgages, and then it all goes south, will Wells Fargo and Chase and US Bank and whoever just go out of business? Hell no they’ll get bailed out, at least some of them, usually the biggest ones. And the bigger the problem they cause the more likely they’ll be bailed out.
The markets are better at hedging “ordinary” risk, like that the price will be 2x higher than normal, not 45x
I am skeptical that refining a reduced form model is the right approach. Electricity prices are the outcome of a market process, with various technological and economic constraints on both the supply and the demand sides. Eg high prices make it worthwhile to start gas turbines and other short-term measures to handle intermittent high demand, while on the demand side a company with a flexible production process may stop production for a short period when prices are too high. There is, of course, room for random events too, especially problems with the electricity network caused by natural disasters.
I am not familiar with this field, so maybe someone already tried structural models, but the first I would think of is a small model with a few types of agents on both sides with different technological constraints (the crude way to model this would be elasticities, but adjustment costs would make more sense). A hidden variable model could be approximating that, but since has no structure imposed by theory, estimating its parameters would require a lot of data.
I’m with Tamas 100% and implement it in Julia 😉
I would guess energy traders use statistical models but it’s for sure not the only thing they use. I think it’s more like trading in commodities futures. There are all sorts of forces in play — the war in Ukraine and its effect on natural gas prices; the overall economy (inflation, depression, whatever); prospects for an unusually hot or cool summer, how many people are buying electric cars and how much will they need to charge them; and on and on and on. The agent-based model of Daniel’s dreams is just that — a dream — because with current technology there is no way to synthesize this stuff into a formal quantitative model.
But the people who try to synthesize this stuff for a living also make lousy predictions. It’s just a really hard problem.
Phil, agent based models are very doable, you just need to not think of them as detailed models that have to be correct. There is no way to model humans accurately at the individual level but fortunately many things it’s enough to understand the behavior of averages or distributions. Build an agent based model with 5-6 kinds of consumers… Let’s say mfg plants, households, frozen warehouses, govt buildings, street lights and hospitals…
Now adjust the parameters of decision making for each group, and apply the same supply shock, run each scenario 5 times… Now you have a population of outcomes. Keep only those scenarios where the outcomes are not “too far” from what really happened. Then using that distribution, run forward through a series of expert chosen plausible scenarios for future shocks… Look at the distribution of outcomes…
Based on the distribution of outcomes, decide on a hedge price that is break even, and buy hedges that fall below the brake even price.
You probably need to run several thousand simulations, and do some post processing analysis but all of this is doable
I have no reason to believe that this would make predictions that are any better than ‘my’ model in any way, and it would be a lot more work.
You may be right. The main reason to do these things though is to be able to handle situations that haven’t been seen in the past but are thought to be of potential importance for the future. Also situations with interactions. For example suppose the power goes down in Texas next time because of a heat related issue. Now hospitals and frozen warehouses maybe have a different response to heat based emergencies than mfg plants and govt buildings… If you have rules for behavior that express these choices you may well wind up with a better ability to express conditional outcomes even if you can’t tell which is more likely a heat or cold or flood or fire emergency…
The price of electricity and the overall demand for it are obviously related, however the frozen warehouses demand and overall demand are not necessarily related. If another cold weather emergency occurs the plant might choose to ride it out as it’s not a big threat to frozen goods while households and non frozen goods warehouses desperately compete for whatever electricity is available to keep from freezing. Perhaps in this condition the client makes money reselling their hedged electricity to others, while in a different hot weather condition the frozen warehouse melts down even though they’ve pre-bought electricity because supply just doesn’t exist… These kinds of scenarios can be analyzed in a rule based model, a time series model not so much.
The main use of the rule based model would be to “stress test” the response to some scenarios that are thought to be relevant. You’re not so much predicting what will happen as much as what would happen if bad event comes along.
Consider the Fukushima powerplant. It would have been good to have a model that would answer “what if a 15m high tsunami comes through” even if such a thing was pretty unlikely to actually occur.
But developing a rule based analysis is a nontrivial task and very different from the one you’re currently involved in. Perhaps more for a second or third round of modeling than for current project.
More post on time series please ;-)
Rob J. Hyndman, perhaps the world’s top researcher in time series forecasting, has once said he is quite proud of his electricity price forecasting model for (some region of) Australia. I think the relevant academic paper is this one (though you could check if there are any other similar ones by him): https://robjhyndman.com/papers/MEFMR1.pdf
Hmm, no, this is demand forecasting, not price forecasting. Sorry! There is also this overview article in the International Journal of Forecasting by Rafal Weron: “Electricity price forecasting: A review of the state-of-the-art with a look into the future” https://www.sciencedirect.com/science/article/pii/S0169207014001083. It is a few years old now, but Weron and his students have continued working on electricity price forecasting, so they might be on to something.
Well, we need demand forecasting too. If my client decides that they want to be ‘fully hedged’ — they want to buy all next July’s electricity now, just to take all the uncertainty out of it — they still need to know how much that is. Their demand forecast is much more certain than their price forecast — if they assume they’ll use about as much electricity next July as they did this July, that’s unlikely to be off by a factor of 2 — but sometimes crazy things happen here too. In Southern California there are facilities that have ‘blast freezers’ for quickly freezing things that need to be frozen quickly: berries, squid, etc. Normally the strawberry season and the squid season don’t quite coincide, so they spend a month or so freezing squid and then switch to strawberries (or maybe it’s the other way around) and there’s not a lot of overlap. But a few years ago the strawberries got ripe early and the squid came in late (or maybe vice versa) and they had ‘squidmaggedon’, more product than they could handle. Overtime, extra shifts, all hands on deck…and a huge, huge electric load for the month. So even though load is less volatile than price, it still needs a forecast and the forecast still needs tails.
So: thank you very much! I will look at this.
Perhaps I’m missing something but as a financial – this reads like a value at risk problem? The approach I am familiar with from actuarial science is to split the distribution in two parts: one for the common events and one for the tail. Hill estimator for the cutoff point. Calibrate both to satisfaction and simulate. Then you can talk the client through different levels / scenarios of mitigation (for an insurer often reinsurance, but the same approach would hold for buying some levels of protection with say energy price futures, or whatever instruments are available). I have a feeling the problem you seem to be modelling (prices-X-days-out) is a lot more complex than modelling the distribution dropping the time series part and then optimizing based on scenario’s.
It is indeed a VAR problem, indeed CVAR95 is a key part of the calculation. In fact, that’s really what the load and price forecasts are all about: how much electricity will they need, and how much will it cost per unit, and what does the statistical distribution of the resulting total cost look like?
And the approach we take is very similar to what you describe: we have a distribution for ‘typical’ months — I’d say ‘normal’ but I don’t want to imply it’s a Gaussian distribution — and another distribution for ‘atypical’ months, and we assume the statistical distribution of possible prices is a mixture of these two distributions. We use the time series model to get the distribution for ‘typical’ months, but a lot of the tail risk is in the ‘atypical’ months. So, yeah, we are on the same page it sounds like.
From a decision perspective, aren’t the atypical months the only parts of the problem that actually matter for decision-making?
You say that, as one would expect from basic economics, that buying insurance for most months is -EV because you pay a premium to move that risk to someone else (who needs overhead & profit). So in almost all months, it’s not worth buying the insurance compared to ‘self-insuring’; you do not need to do any fancy modeling to know this.
The decisions that will change are the ones in, let’s say, July-Aug and Feb-Apr as the ‘danger’ months. Those are the only months whose forecasts matter, because that’s when the decision to buy or not buy insurance will be made. But your models like GARCH or whatever are almost entirely about minimizing forecasting error in the average case of month to month fluctuations in the usual range. So improvements there are almost certainly irrelevant to the decision-making. Indeed, if they are misspecified (as they presumably are given that you say you can’t recover the actual extremes) they may be doing worse on the extremes even as they reduce their total ‘error’.
Further, you do not need to care about long-term trends such as climate change, because the decision is being made on a short-term basis, and you can assume that it will always be worthwhile to purchase electricity (because otherwise the warehouse or whatever would have gone out of business). If climate change increases the mean, then that’ll show up in whatever is being conditioned on at the time of decision-making, and does not need to be known in advance.
So, it seems like the only aspect of your models which matters is the order statistics which you say it doesn’t handle: the ‘crazy spikes’ in danger months. How well does your model perform if you do a backtest of decision-making using it versus some simple baselines like ‘always buy insurance’ / ‘always buy insurance only in danger months’ / ‘never buy insurance’? How well does a backtest perform if you simply take the time-series and resample it, including the February spike? I suspect the optimal policy here will look pretty simple, like either ‘never buy insurance’ or ‘always buy in a danger month’, and any modeling or sampling is just ‘sampling to a foregone conclusion’, as it were, because the reality is so far away from a decision boundary that no refinement to the model or plausible improvement in forecasting a spike that specific month will wind up changing any decisions – and so the VoI of you building a better model is $0.
Regarding the last part, the MARSS package team have published quite a few nice examples in their package’s documentation: https://cran.r-project.org/web/packages/MARSS/vignettes/UserGuide.pdf
Also check the book related with their course, they also tackle the problem of changing seasonality: https://atsa-es.github.io/atsa-labs/
In general, time series are tough, it is hard to get anything better than the typical season+trend+noise model, and I don’t think there is sensitive way to predict spikes like those.
Yeah, you’ll never predict the spikes in advance without at least a partially causal model that includes relevant information about the future values of the causal parameters. That’s not going to happen. The best we can hope for is to maybe forecast the average frequency and/or magnitude of the spikes when they occur. Even that is very challenging (or maybe impossible), especially to the extent that the market is changing such that the past frequency and magnitudes are not expected to hold in the future.
Thanks for the references, I will take a look at those.
This post reads to me like you don’t understand what forecasting is or how to use it.
With forecasting you’re trying to make a stable prediction outward in time. But what you’re really interested in modeling is risk (the likelihood prices spike across a certain threshold), and anomalies (the occurrences of rare and extreme events).
Those are things you can model, and then you can use the results from those other analyses to inform and adjust your forecasts, but what you’re trying to do isn’t what forecasts were designed to do. You’re using the wrong statistical tests for your actual research questions.
I didn’t mention any statistical tests so I don’t know what you mean by your final sentence.
‘Forecasting’ covers a lot of ground, and can include forecasting the probability of unlikely events. So I think you’re the one who doesn’t understand what forecasting is!
a few questions/thoughts:
In this application, it seems like it would take very little electricity to keep stuff cold if it is freezing outside so the model might have different risks in cost per hour for winter and summer?
I presume these places have backup generators. Is it worth just running the backup generators when the cost per KWH is larger than the cost to run the generators?
IIRC an additional problem is that Texas is not connected to the rest of the US to avoid federal energy regulation which greatly exacerbated the problem with the freeze up
Texas freeze anecdote: while in college in Houston in the early 60’s, it went below freezing for a few days. Someone must have suggested on the radio to turn on outside taps to avoid freezing. Everyone did, full blast. Dropped water pressure to zero and blew through available treated water. Non- tank (flushometer?) toilets could not flush, no water above the first floor. Those who could went home, the rest of us got portable toilets in the quad
Funny story.
You’re right that demand at these facilities tends to be lower in winter due to the indoor-outdoor temperature difference being a lot smaller.
And yes, most of these these places do have backup generators, with the size of the generators and the amount of fuel they keep on hand varying by location because of variable perceptions of the risk of long outages or high-price periods. These facilities are ginormous consumers of electricity and it would cost a lot to have a big enough generator and enough fuel on hand to operate completely off the grid for more than a few hours. If there’s an outage that is predicted to be more than a couple of hours the facilities will often shut down operations — they don’t want to be bringing in any products that are at higher than the indoor temperature and thus making things warm up, and they also don’t want loading doors opening and closing (even though the sides of the doors quickly seal tightly around the trucks) because that’s a significant source of leakage. There’s an enormous thermal mass of 0F food and equipment and if they just shut everything down the facility will stay near 0F for a long time.
Anyway you are right that the operating costs vary by outdoor temperature, and that the facilities try to be smart about optimizing the amount of generating capacity they have and the way they use it to get through costly periods or periods with no grid power.
“In this application, it seems like it would take very little electricity to keep stuff cold if it is freezing outside”
I lived in Winnipeg for a while. I always thought it was hilarious to walk down the frozen foods aisle in the middle of winter, where the company is paying to heat the building and then paying again to keep peas and corn dogs frozen when it’s -30C outside.
There must be some sensible way…
Anon:
I was curious so I went to wikipedia to look up famous people from Winnipeg. The only name I recognized was “William Stephenson (known as ‘Intrepid’).” Maybe the problem is that the wikipedia page, “List of people from Winnipeg,” includes too many nobodies and not enough actual famous people.
Niles, Michigan does much better despite being a much smaller place. I guess it was better situated, back in the day.
P.S. No, I don’t count “Philip Kives, founder of K-tel”: I remember K-tel but not Philip Kives).
Monty Hall is famous – and relevant for a Decision Theory blog post.
Carlos:
Indeed! Also Neil Young, who I hadn’t noticed at first. They really need a separate page, Actually Famous People From Winnipeg.
They could have a page “People From Winnipeg Who Are Famous Outside Of Winnipeg.
Brent:
Perhaps that page exists but is only accessible from Winnipeg.
This makes me think of the currently popular book “How the World Really Works”, where ‘really’ seems like it doesn’t convey any information, but it does.
Just to answer your first question, the standard value for anything freezer-like in Europe is usually -18 °C, which is almost exactly 0 °F (-0.4 °F to be precise).
That’s great, thanks for letting me know! That’s a fun fact.
I claim very little domain knowledge of the electrical price market but let me offer some thoughts (some quite obvious) as a (mostly) former wall street quant and model builder with a background in finance/econometrics/OR.
You’re never going to be able to build a forecasting model of an asset’s price time series in any meaningful way. And, even if you got close, the black swan events will be, by definition, unpredictable. Given the Black Swan events are what you need to hedge against…yeah – it’s a tough problem.
If I can frame your problem slightly differently – your client doesn’t need specific forecasts or statistical distributions of that univariate time series. What they need is a plan to deal with the impact of shocks to their P&L. Those are different problems. IOW, they don’t want to get blown up. My first (naïve) thought would be to examine developing a Cointegration model that you might be able to use for the purposes of creating viable hedges. Plenty of papers on electricity trading seem to go in that direction.
The main problem with cointegration trading models (and all trading models) is when the model appears to be breaking down. Those issues appear when the p&l profile dramatically changes, and that usually happens when the extremes are really extreme and there is no rules-based plan in place to manage those situations. The compelling question then is: has the model failed or has there been a regime change? That’s where the rubber meets the road.
From my experience (and your mileage may vary), robustness, non-parametric statistics, and ultimately KISS are the keys. There’s so much uncertainty in everything from distributions to estimation and so much domain gobbledygook to overcome that my advice is to look to develop models that “satisfice” (Herb Simon term for “good enough”) your objective function. Please note, my world was one where we hoped to be right on say 55% of bets we made over dozens, if not hundreds of individual stocks or portfolios. Your mileage probably differs in that you’re looking to hedge one situation. Even so, trying to apply too many degrees of specificity to this type of problem will likely lead you down multiple rabbit holes to hell. #beenthere
I can talk forever about building trading models. Obviously, there are data-mining issues to avoid, developing sound economic hypotheses as to why relationships should exist (and then not killing ourselves to force square arguments into round holes just to get stuff done because of the internal corporate pressures), and ultimately hopefully not fooling ourselves by rigorously testing every idea out of sample.
The more in the weeds we got, the systematically worse the out-of-sample performance. In other words, although we started with grandiose ideas, parsimony (as we were often taught in school) did rule. Applying a level of specificity that wasn’t warranted given the multiple levels of complexity we threw at the problem just couldn’t be justified. Our models weren’t simple, but they were an order of magnitude simpler than we had initially expected.
I’ll leave you with this: trading to a model, any model, can be a minefield. There’s always the joint hypothesis problem (Fama 1970), and also the notion that extremes are extremes only when the model is stationary & mean-reverting, and a necessary condition for that is for the model 2b ergodic. Since this ain’t physics, model-based trading strategies must be ready to justify: “Which model & under what time horizon?”
David,
Thanks very much for this convincingly common-sense advice. I will point it out to my client and my colleagues. I think we are already trying to apply the principles you’ve outlined. We started with very simple models for both load and price — just SARIMAX — but then those turned out to be too simple: a single crazy month would have too much effect on subsequent predictions, but, on the other hand, the error bars for forecasts from the models did not have adequate coverage. So we added a bit more sophistication, but tried to make it the minimum amount that could conceivably capture the behavior we need. At times we have quoted the (apocryphal) Einstein quote “Make your model as simple as possible, but no simpler.” Actually it’s amazing how complicated even our simple approach has gotten. We are giving the client several ways to put their thumb on the scale — they can adjust their risk tolerance, and move the forecasted price distribution around, and change the assumed probability of an atypical price month, and move the forecasted load distribution around, and adjust the assumed relationship between price and premium… on the one hand our tool has as few complications as we could manage while still preserving the necessary features, but on the other hand it is complicated enough that we sometimes confuse even ourselves, e.g. “wait a second, why does the recommended hedge purchase go _up_ in this test case when we increase the price of the hedge?”
Anyway I think we are already trying to do most of what you advise, but I’ll make sure the whole team sees this.
One thing. You say “If I can frame your problem slightly differently – your client doesn’t need specific forecasts or statistical distributions of that univariate time series. What they need is a plan to deal with the impact of shocks to their P&L. Those are different problems.” I agree with part of this but there’s a part I don’t understand (which is not the same as saying I disagree with it). For one thing, you’re right that we don’t care about a univariate time series. But we do think of this in terms of a _bivariate_ time series: how much electricity do they need to buy (the load), and how much will it cost (the price per MWh)? Actually there is a whole other dimension to this, which is how effectively they can decrease load during high-price periods — an issue I touched on in the comments above — but let’s skip that for now. To some extent I do think we care about the bivariate time series: what is the joint distribution of price and load. So, yeah, not univariate but bivariate. But I think you are saying more than that, that there’s a difference between having a month with an extremely high electricity bill and “the impact of shocks to their P&L.” Those sound like the same thing me.
Thanks again for your advice!
So, my original response was 3x the size of what i posted (i got way too much into the weeds). “Those are different problems” was the key point i was trying to get across. As to univariate vs. bivariate vs….multiple variate: i should have been more explicit and stated that Box-Jenkins (and extensions) would not be your friend in modeling electricity prices with ‘large’ shocks. I’m not even so sure modeling prices makes any sense at all (remember, in classical finance, prices are never important – we deal in return space and not in a forecasting sense, but in a distributional sense).
My suggestion is to explore the world of VAR, VEC, & ECM (Cointegration). I believe that domain will be more hospitable than working in the ARCH/GARCH world for this kind of problem, While, u can build models in the A/G domain and pull out common factors within the model itself, i think it’s much cleaner to pre-condition your data explicitly (it allows u many more degrees of freedom) and then deal with the main issue (hedging the residuals) directly and separately. Cointegration DOES live in price-space, not return-space. (note: with equities, u do need to convert prices to pseudo-prices by removing the dividend effect – that’s trivial – i don’t believe u have any similar issues with electricity prices – they’re probably pure).
My initial sense was that if there is some cointegrating relationship between some lagged exogenous variables and electricity spikes, then the development of a hedging program that satisfices wouldn’t be horrible. That said, if it were that easy, it would have been done years ago and you’d likely have found papers galore on it. But, my guess is that you’re more likely to find a contemporaneous relationship, not a lagged one. Still, it could be the case that if u can isolate that cointegrating variable or variables, there’s a chance that a hedging program will be easier to implement. The key will be is how stable the long-run cointegrating relationship is over time and when pushed around in the short-run by those extreme results. We found that incorporating a hysteresis factor helped us greatly in dealing with big shocks.
U need more Data!
1. River tides, temperature Data in order to cpunt f.e. for France nuclear energy problems..
2. Trade Export Import Data of oil, Gas/ uncertainty indexes
3. ..
I’m pretty sure Taleb himself would object to calling something expected-but-infrequent a “black swan”. A black swan is something NEVER seen before or expected, as such swans themselves were to Europeans prior to reaching Australia.
Some random observations:
1. In the long term, the model behavior should essentially revert to seasonality effects + an overall trend. So most of the interesting bits of this model are in the short run trends conditional on the present and forward simulations of heavy tailed phenomena
2. It looks like time and the past values of electricity prices are conditioned on, while other things that affect electricity price like Russia-Saudi Arabia trade wars and weather forecasts are “noise”. That seems like a reasonable breakdown; once you include things that are uncertain you have to build a separate forecast of those and propagate the uncertainty through. I’d be interest in trying out other things that are known with certainty into the future, like planned electricity tax hikes/cuts, el nino and la nina cycles, and other non-annual periodic weather phenomena. But probably not worth it.
Where 1 & 2 have an interesting interaction is that inside what we’re pretending is black box noise, there is information we do have about how long an effect will last. There’s a shock from some crazy event that pushes prices up or down, and I agree we won’t be able to forecast those. But once they’ve happened, we do know that some types of shocks last longer or shorter, but we’re writing all of those into noise and using the same autocorrelation model. If we see a spike due to a winter storm, we know the storm can’t last much longer than a couple days and they should be able to restore service relatively quickly, while a spike due to a war between two supplier nations can last as long as it takes to reshore the relevant pipelines. This is where I think there can be some gains in letting some art meet the science. I’m not sure of how to do this in a principled way, but maybe a fitted autocorrelation_scale parameter that controls how quickly your latent state variable can move which users can tweak for the short term forecast for some counterfactuals?
Correct me if I’m wrong, but it looks the recent trend + random month effect is how you’re handling short term autocorrelations and seasonality? I’ve found it more intuitive to treat seasonal effects as fixed and handle short term autocorrelations separately. For seasonality I mix in a periodic spline basis that’s fixed over all periods. For short term autocorrelations I’d use:
1. A more classical state space model where prices drift noisily with pressure from time trends and seasonality pushing it towards the mean of the series over long time horizons, with prices treated as point in time observations. This can be even slower if you go full stochastic differential equation, but you can euler mauryama approximate it as a difference equation.
2. A moving average style model where the centrality of next month’s deviation from the time + seasonality mean is determined by a linear combination of the last n residuals.
Again, the art in either of these approaches will be in the speed of the mean reversion in unusual circumstances. While the “ordinary” mean reversion can be driven primarily by data, there won’t be enough data to regulate the behavior following heavy tailed shocks, and we’ll also have lots of subjective information about where those major shocks come from that are tough to incorporate into the model in a general way.
Why do you prefer the mixture model? The long tailed distribution seems easier to handle since you don’t have to muck around with marginalizing over the “switch” parameter with a log_sum_exp operation, and I suspect it’d be faster as a result (though I don’t know). In addition, the mixture model guarantees that the effect of large shocks on the immediate future forecast will saturate as the implied probability that the shock is drawn from the wide distribution approaches 1. That’s probably good sometimes and bad other times–my concern is that it’s hard to artfully tune.
In either case, the data won’t provide very much information about your wide distribution’s tails; it’ll be dominated your prior. Here’s where theoretically motivated agent based models may help; you can use theory and forward simulations to estimate a “worst realistic case prior” for your heavy tailed noise distribution, then use that prior to propagate the worst case into your forecast’s uncertainty analysis. It’d be a bound rather than a true estimate, but as David Rothman pointed out, making sure your organization is protected against the shock will satisfice.
And another thing, something that might be relevant to the decision analysis is if the prices are “artificial” in some way, like hitting a government determined price ceiling, you might not be able to buy anything at all because there will be a shortage.
Sorry, forgot to give my critiques of this
1. I’m concerned that the mixing of two random draws here creates an anticorrelation between the two draws and so an identifiability/performance problem in the posterior
2. Using “month effects” throws away locality information (July effects should be closer to June effects than to December effects) which could help speed up and regularize your fit
3. The model is only vaguely specified in my head, but it doesn’t seem like it disambiguates long and short term trends, but I have strong theoretical reasons to believe the long term trend should a log-linear growth closely coupled to the general rate of inflation.
More on this
The mixture model approach will also have difficulty capturing the skew in tail risk; commodities prices are positively skewed, and are more likely to crash upwards than downwards (unlike equities).
Been thinking on this because it’s similar to something I’ve been doing for work