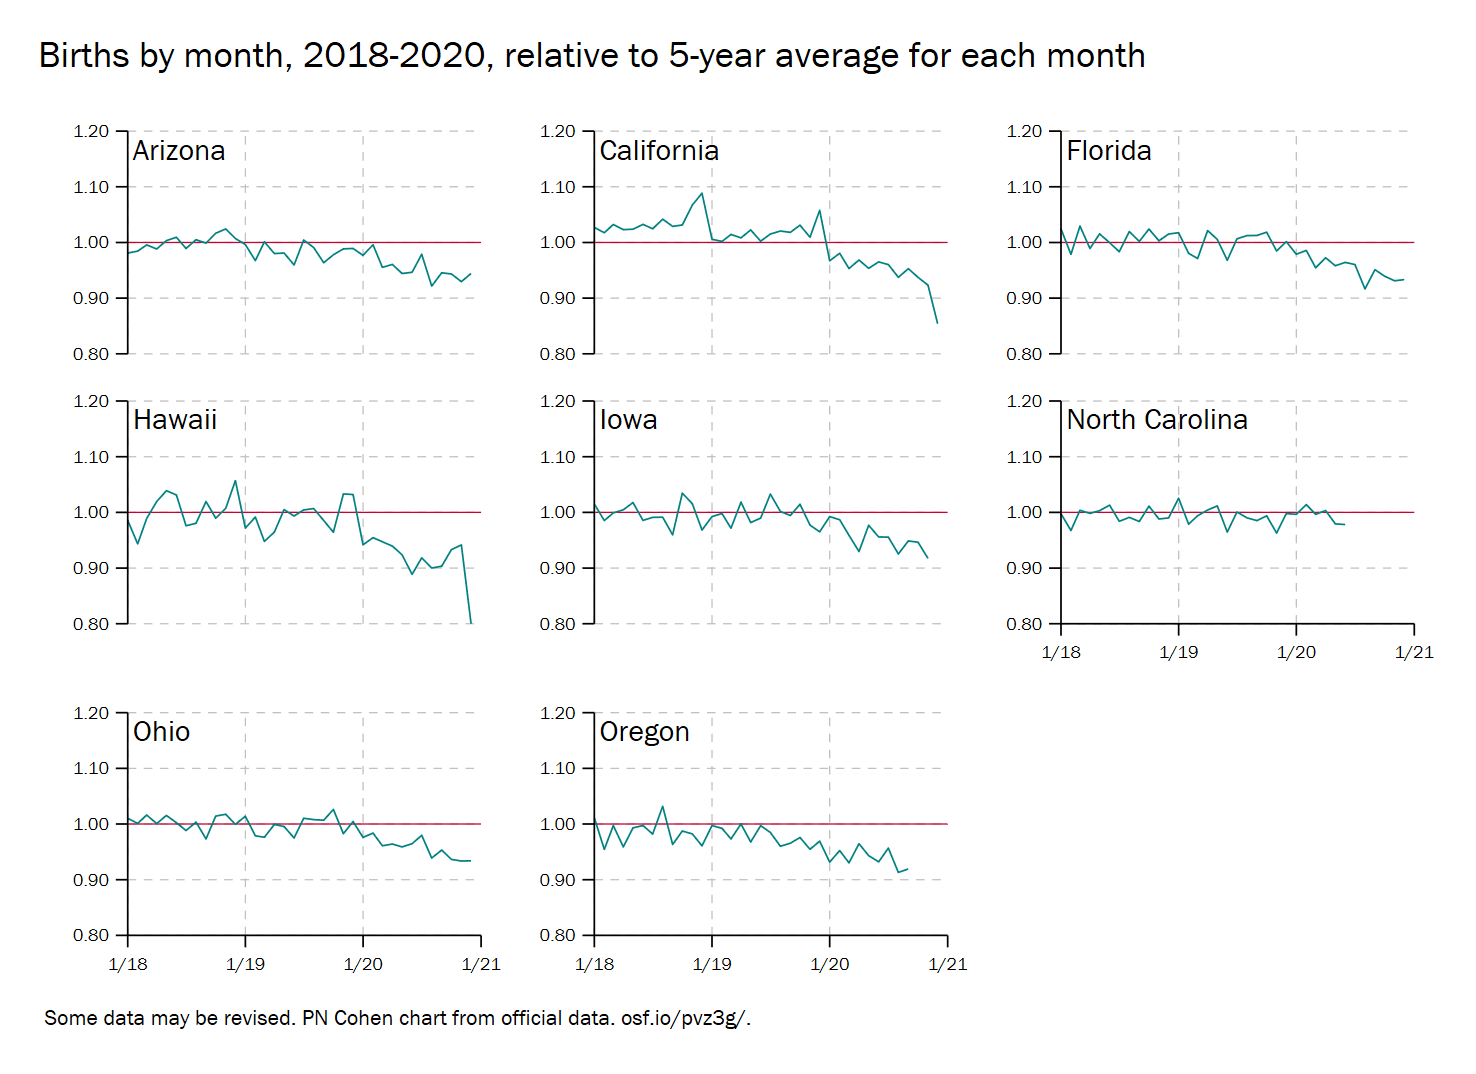
Philip Cohen shares the above image and writes:
One thing we don’t yet know is how much of [the change in California] is driven by people moving around, rather than just changes in birth rates. California in 2019 had more people leaving the state (before the pandemic) than before, and presumably there have been essentially no international immigrants in 2020. Hawaii also has some “birth tourism”, which probably didn’t happen in 2020, and has had a bad year for tourism generally. . . .
From the few non-US places that I [Cohen] am getting monthly data so far, the trend is not so dramatic.
This is relevant to our discussion, “Will the pandemic cause a decline in births? We’ll be able to resolve this particular debate in about 9 months . . .”
P.S. I’d prefer not to see the states graphed in alphabetical order, as that wastes one of the dimensions of plotting.
Thanks for sharing, Andrew.
I have updated this periodically. Here’s as of June 3: https://twitter.com/familyunequal/status/1400542432589193216 (including some countries as well as states.)
Good point about alphabetical. This thing in Stata must have an easy way to sort the plots but I never took the time to figure out what it is. On the other hand if there are a lot sometimes alphabetical makes it easier to find the one you want
To sort the plots the way you want in Stata, first create a value label that lists them in the order you want. Then use -encode- with that label to convert the state/country variable to a numeric variable. Then combine the graphs. So something like this:
label define plot_order 1 “First State” 2 “2nd State” 3 “Third State” // … etc.
encode state_variable, gen(ordered_state) label(plot_order)
graph /*insert graph command details here*/, by(ordered_state)
Yes, but that method won’t be easy to use programmatically without a looping structure to create the value label.
Something like:
sort size (or whatever to get things in the right order)
forvalues j in 1/50 {
label define plotorder `i’ state[`i’],add
}
Many of those curves start dropping before 1/20. What can we make of that? The pandemic wasn’t going in earnest until March, 2020 (or you could argue February, but that doesn’t matter for this point).
The birth rate in the US has been dropping for quite some time so some of those drops might just be the existing trend.
That might just represent pre-existing declines in the US birthrate. The US was already experiencing a decline in birthrate prior to the pandemic.
It’s great to see the graphs for different states. This gives us much more depth than we would get from staring at a single time series (just the U.S. or just one state).
In my current professional role, I am required to have opinions about what is going on with California’s population, and I will say that the expert consensus seems pretty confident that international in-migration slowed to a trickle during the pandemic, so assuming the historically true bit about higher birth rates among many categories of immigrants still holds (and honestly I haven’t looked at the literature on this point in several years, so maybe people don’t believe this anymore), I would suspect this issue also contributes, and it is separate from but related to the birth tourism issue.
The fact that these trends begin near the start of the pandemic and not ~9+ months later seems to indicate that it’s not a pandemic-induced baby bust, no?
Good questions. Here are a few replies.
Yes, birth rates were trending downward. That doesn’t mean this is “just” an extension of that. It’s within the rules of history that one change compounds another, ongoing, change — even if it makes it hard to study.
Yes, also, there were signs of falling births in the summer and fall, before the pandemic’s major effects were nine months old. We might never be able to sort all that out. However, the declines in December and January were of truly epic proportions (on the order of 10%), and the annual decline in the US birthrate was the biggest since the end of the Baby Boom.
We will know more soon, and better people than me are on the case. But I have done some analysis of variation across counties. Here’s a preprint abstract:
The United States experienced a 3.8 percent decline in births for 2020 compared with 2019, but the rate of decline was much faster at the end of the year (8 percent in December), suggesting dramatic early effects of the COVID-19 pandemic, which began affecting social life in late March 2020. Using birth data from Florida and Ohio counties through February 2021, this analysis examines whether and how much falling birth rates were associated with local pandemic conditions, specifically infection rates and reductions in geographic mobility. Results show that the vast majority of counties experienced declining births, suggestive of a general influence of the pandemic, but also that declines were steeper in places with greater prevalence of COVID-19 infections and more extensive reductions in mobility. The latter result is consistent with more direct influences of the pandemic on family planning or sexual behavior. The idea that social isolation would cause an increase in subsequent births receives no support.
The paper is here: https://osf.io/preprints/socarxiv/qwxz3/.