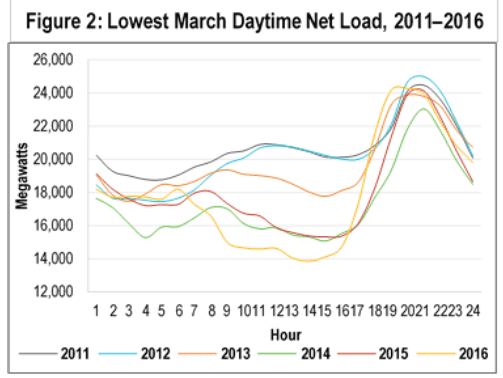
Electric load (the amount of electricity provided by the electric grid) in the middle of the day has been decreasing year by year in California as alternative energy sources (mostly solar) are added.
Time series of energy use by time of day in California. The middle of the day gets lower and lower.