I guess people really do read the Wall Street Journal . . .
Edward Adelman sent me the above clipping and calculation and writes:
What am I missing? I do not see the 60%.
And Richard Rasiej sends me a longer note making the same point:
So here I am, teaching another statistics class, this time at Santa Monica College, and reading the Wall Street Journal before heading in to school. Not surprisingly, extremely intrigued by the article about the ‘Hot Hand’.
I know you were quoted in it, although it looks like some of the quote got cut off somehow.
Anyway, I was very confused by the piece and did a little pencil and paper work, and am not quite sure I buy it. Admittedly, I did not try to find the original paper or commentary, but based my doodling on the description in the article.
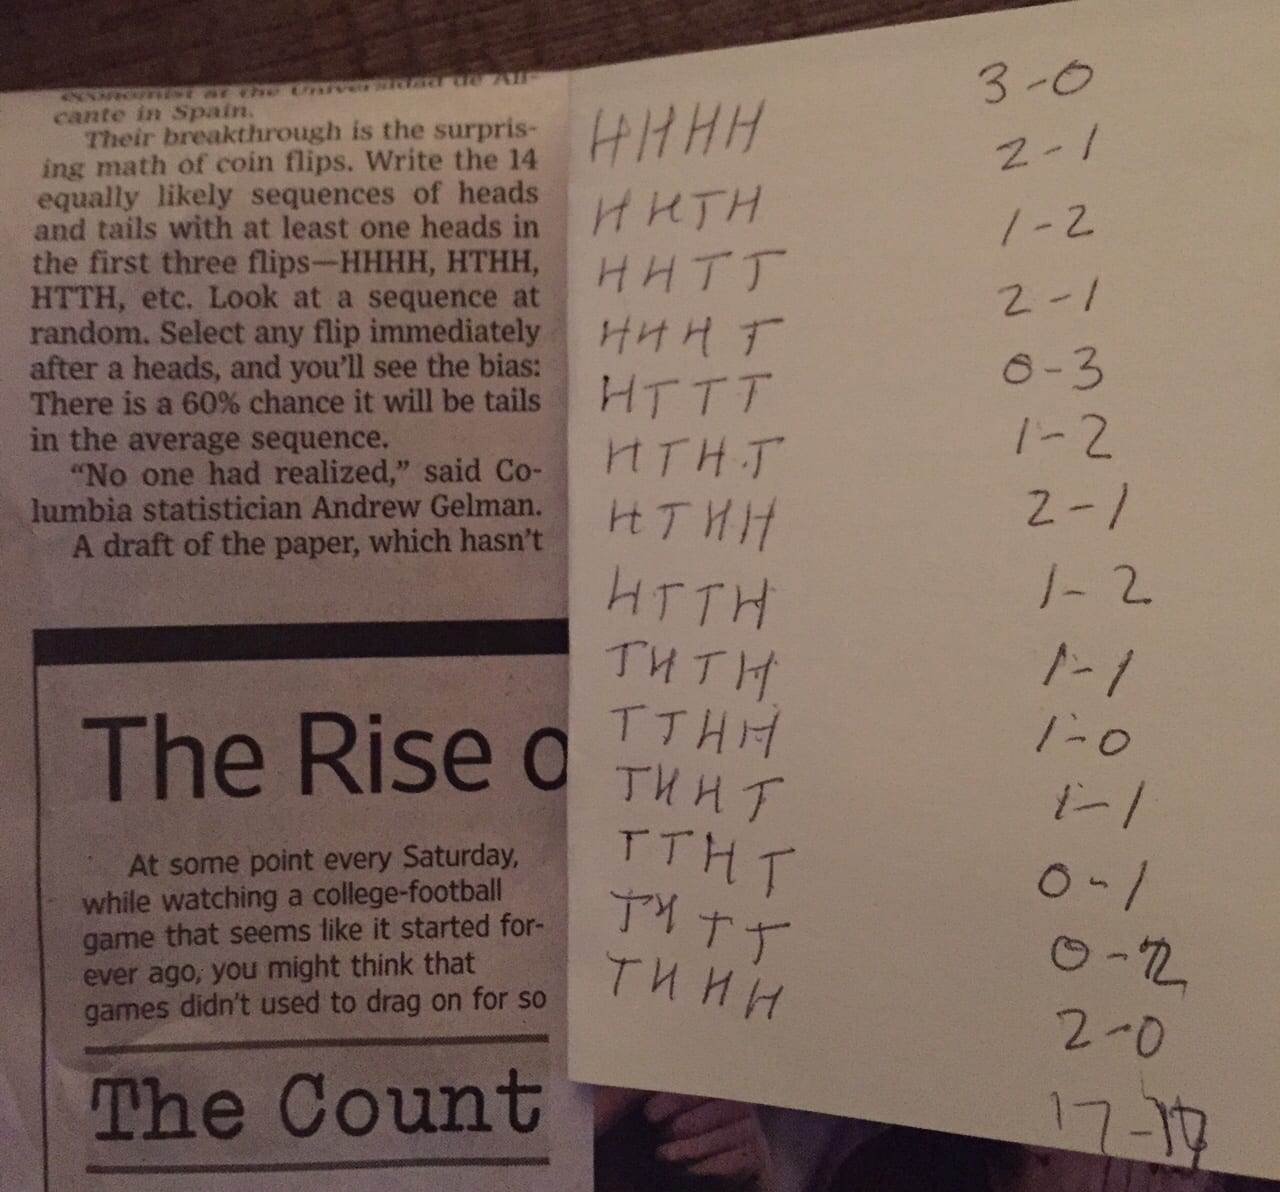
As I understand it, we look at the 14 out of 16 possible sequences of 4 coin tosses which do not begin TTT (in order to have at least one H).
Then, whenever there is an H in the subsequence of the first three tosses, we look at whether or not it is followed by a T.
So I wrote all 14 down, and for each one looked at how often a T follows an F.
Here’s what I found:
HHHH: 3 opportunities, 0 Ts
HHHT: 3 opportunities, 1 T
HHTH: 2 opportunities, 1 T
HHTT: 2 opportunities, 1 T
HTHH: 2 opportunities, 1 T
HTHT: 2 opportunities, 2 Ts
HTTH: 1 opportunity, 1 T
HTTT: 1 opportunity, 1 T
THHH: 2 opportunities, 0 Ts
THHT: 2 opportunities, 1 T
THTH: 1 opportunity, 1 T
THTT: 1 opportunity, 1 T
TTHH: 1 opportunity, 0 Ts
TTHT: 1 opportunity, 1 TThis seems to total up to 24 opportunities to see whether or not an H in in first three positions is followed by a T, and a total of 12 Ts, for 50%. So I don’t see where the 60% mentioned in the article comes from.
Also, note that the coin toss in the fourth position is irrelevant to this count, since the simulation is for only four tosses – so we never know what happens on the “fifth” toss.
Besides not understanding where the 60% comes from, how much of this (what is alleged in the article) is an artifact of the length of the sequence of tosses? Rather than restricting ourselves to sequences of length 4, should not the analysis look at sequences of all lengths? That is, start with tosses of length 2, 3, 4, 5, 6, etc., measure the frequency with which a T follows an H in the possible subsequences of lengths 1, 2, 3, 4, 5, etc., and then try to determine if the sequence of proportions converges?
My reply to both:
You get the non-50% number by first computing the percentage for each scenario, then averaging the 16 scenarios equally. If you weight by the number of opportunities you indeed get the correct answer of 50% here, but the point is that when the hot hand has traditionally been estimated, the estimation has been done by taking the empirical difference for each player, and then taking a simple (not weighted) average across players, hence the bias, as explained and explored in several recent papers by Josh Miller and Adam Sanjurjo.
P.S. Miller points out that, for real shooting data (as opposed to coin flips) there is no simple weighted averaging that would give you the correct hot-hand estimate, as such an average would not correct for differences between players. That’s why I think the ultimate way to go will be to fit a Bayesian analysis using Stan. We’ve done some steps toward this but our model is still in a simple and preliminary stage.
In the quote from Richard Rasiej, “how often a T follows an F” should be “how often a T follows an H”.
Are your Stan analyses available to the public?
The article probably could have been written a little better (or have linked to your original blog post!). Your original method of explaining this with a simulation is probably the best way to get people comfortable with this, though I can’t think of a time where I saw code snippets in the NYT, WSJ, etc.
Cheese:
The online version of the WSJ article did link to my blog post!