From Discover:
Razib Khan asks:
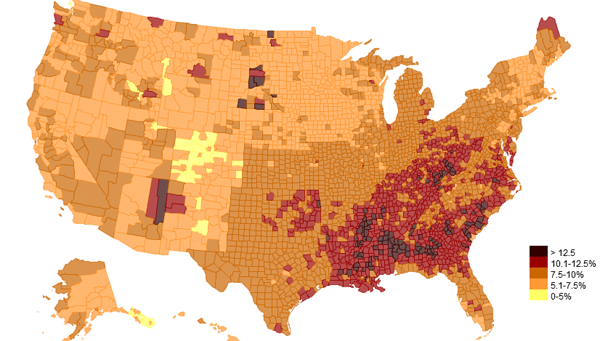
But follow the gradient from El Paso to the Illinois-Missouri border. The differences are small across state lines, but the consistent differences along the borders really don’t make. Are there state-level policies or regulations causing this? Or, are there state-level differences in measurement? This weird pattern shows up in other CDC data I’ve seen.
Turns out that CDC isn’t providing data, they’re providing model. Frank Howland answered:
I suspect the answer has to do with the manner in which the county estimates are produced. I went to the original data source, the CDC, and then to the relevant FAQ.
There they say that the diabetes prevalence estimates come from the “CDC’s Behavioral Risk Factor Surveillance System (BRFSS) and data from the U.S. Census Bureau’s Population Estimates Program. The BRFSS is an ongoing, monthly, state-based telephone survey of the adult population. The survey provides state-specific information”
So the CDC then uses a complicated statistical procedure (“indirect model-dependent estimates” using Bayesian techniques and multilevel Poisson regression models) to go from state to county prevalence estimates. My hunch is that the state level averages thereby affect the county estimates. The FAQ in fact says “State is included as a county-level covariate.”
I’d prefer to have real data, not a model. I’d do the model myself, thank you. Data itself is tricky enough, as J. Stamp said.