Ten ways to rank the Tokyo Olympics, with 10 different winners, and no one losing

(This post is by Kaiser, not Andrew.)

The Tokyo Olympics ended with the U.S. once again topping the medals table, whether you count golds or all medals. Boring! The journalist class moaned. So they found alternative ranking schemes. For example, BBC elevated tiny San Marino to the top based on population. These articles inspired me to write this post.

As statisticians, we all have had snarky comments thrown at us, alleging that we will manufacture any story we like out of data. In a moment of self-reflection, I decided to test this accusation. Is it possible to rank any country on top by inventing different metrics?

I start from this official medals table:

China is #2. After adjusting for the number of athletes, China is #1 in winning golds.

ROC is #3. It is #1 in medals after adjusting for the number of athletes. Its female athletes were particularly successful.

Team GB is #4. I elevate them to #1 by counting the proportion of sports they joined from which they won golds.

The host nation, Japan, came in 5th place. It is #1 when counting the proportion of medals won that were golds.

Australia finished 6th. No worries. It is #1 if I look at how much better the Aussie women were at winning golds than their male compatriots.

Italy is #7. No nation has suffered as much from close calls: it had the highest proportion of medals won that were silvers or bronzes.

Germany is #8. It has the most disappointing campaign, having the biggest drop in golds won compared to Rio 2016.

The Netherlands is #9. Its Olympics athletes showed the largest improvement in total medals compared to Rio 2016.

Our next host nation, France, is #10. It’s ranked #1 if I rank countries by how much their male athletes outperfomed their female compatriots.


So I completed the challenge! It is indeed possible to anoint 10 different winners using 10 different ranking schemes. No country is left behind.

I even limited myself to the Olympics dataset, and didn’t have to merge in other data like population or GDP. Of course, the more variables we have, the easier it is to accomplish this feat.

For those teaching statistics, I recommend this as an exercise: pick some subset of countries, and ask students to come up with metrics that rank each country #1 within the subset, and write appropriate headlines. This exercise trains skills in exploring data, and generating insights.

In the end, I plead guilty as a statistician. We indeed have some superpowers.


Bill James on secondary average

I came across this fun recent post by Bill James, who writes:

[Before Moneyball] batting average completely dominated the market, and most baseball executives into the mid-1990s didn’t have the foggiest notion of the difference between an empty batting average and a productive hitter. And you couldn’t explain it to them, because they didn’t understand the supporting concepts. . . .

I [James] thought of a straightforward way to test, if not this theory perfectly, at least a closely related concept. Before I get to that. . . .I think that I may have invented or at least popularized the expression “an empty batting average”. I could be wrong; you might study it and find that the phrase was in common use before me, or, more likely, that it was occasionally used before me. But I think I created that one. Doesn’t matter.

Anyway, here is the approach. Suppose that we take all players in the era 1950 to 1975 who have either 15 Win Shares or 2.5 WAR in a season. 15 Win Shares and 2.5 WAR (Baseball Reference WAR) are about the same thing; there are not a lot of players who have one but not the other, and also, they represent about the bottom of the barrel for players drawing meaningful support in MVP voting, which is what I am going to be studying here. Take all players with 15 Win Shares or 2.5 WAR in the last quarter-century of the pre-sabermetric era.

Then we look up, for each player (a) his batting average, and (b) his secondary average. Then we can sort the players into three groups . . .

I love this partly for the content and partly because Bill James writes . . . just like Veronica Geng’s affectionate parody of Bill James. I can’t get enough of this stuff! It’s like visiting some country that specializes in a particular dessert, and when you’re there you have to have it with every meal.

James’s essay is also fun because he addresses two related issues: (1) how did the different players perform (as measured by wins above replacement) and (2) what was the mental model of baseball executives: how did they perceive player performance? It’s kind of like what we did in Red State Blue State, where we looked at how people voted, and we also tried to understand how the pundits could’ve kept getting it wrong.

When you have a new idea, it’s not enough to show that it works better than the old idea. You also need to explain why, if your idea is so great, people weren’t already doing it.

And this reminds me of my question when I wrote about James nearly ten years ago for Baseball Prospectus: Given all his writings about empty batting averages and how you shouldn’t take RBI so seriously, how come he provides the following four statistics for every player in his historical abstract: games played, home runs, RBI, and batting average. At the very least, why not give on-base percentage and runs scored?

How much faster is the Tokyo track?

Plot sprinting speeds by year and placing

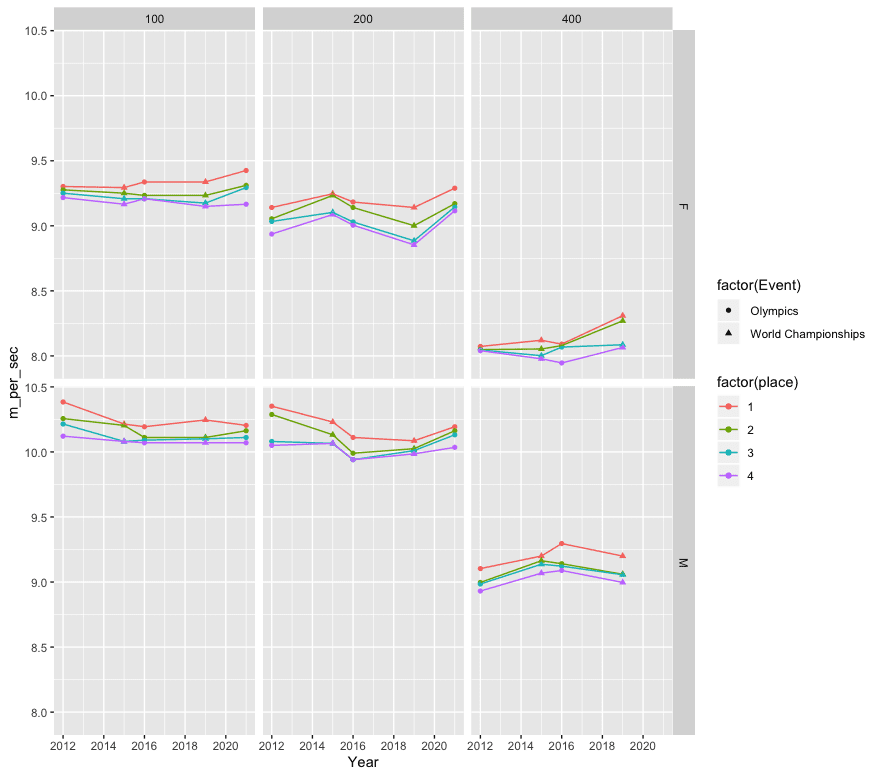
Speed (meters per second) in Olympic and World Championship finals in track sprinting.

This post is by Phil Price, not Andrew.

The guy whose company made the track for the Tokyo Olympic stadium says it’s “1-2% faster” than the track used at the Rio Olympics (which is the same material used at many other tracks), due to a surface that returns more energy to the runners. I’d be interested in an estimate based on empirical data.  Fortunately the Olympics are providing us with plenty of data to work with, but what’s the best approach to doing the analysis?

One obvious possibility is to compare athletes’ performances in Tokyo to their previous performances. For instance, Karsten Warholm just set a world record in the men’s 400m hurdles with a time of 45.94 seconds, which is indeed 1.6% faster than his previous best time. Sydney McLaughlin set a world record in the women’s 400m hurdles at 51.46 seconds, 0.8% faster than her previous time.  So that 1-2% guesstimate looks pretty reasonable.

On the other hand, it’s common for new records to be set at the Olympics: athletes are training to peak at that time, and their effort and adrenaline is never higher. 

I can imagine various models that could be fit, such as a model that predicts an athlete’s time based on their previous performances, with ‘athlete effects’ as well as indicator variables for major events such as World Championships and the Olympics, and with indicator variables for track surfaces themselves. But getting all the data would be a huge pain, I think.

Another possibility is to look at the first-place times for each event: instead of comparing Karsten Warholm’s Olympic time to his other most recent competition times, we could compare (the first place time in the 400m hurdles at the Olympics) to (the first place time in the 400m hurdles at a previous major competition). We might not be comparing McLaughlin to McLaughlin this way, we’d be comparing McLaughlin to whoever won the last World Championship in the event, but maybe this approach would help remove the influence of the time-dependence of a single person’s training fitness and such. There are some problems with this approach too, though, with the most obvious one being that some athletes are simply faster than others and that is going to add a lot of noise to the system. Usain Bolt sure made that Beijing track look fast, didn’t he?

A technology-based solution would be to use some sort of running robot that can run at a fixed power output. You could run it on different tracks and quantify the speed difference. But as far as I know such a robot does not exist, and even if it did, it would have to use almost the same biomechanics as a human runner if the results are to be applicable.

Everything I’ve listed above seems like a huge pain. But there’s something that would be easier, that I think would be almost as good: compare the third- or fourth-fastest times in Tokyo with the third- or fourth-fastest times at other competitions. The idea is that the third-fastest time should be more stable than the fastest time, since a single freak performance or exceptional athlete won’t matter…basically the same reason for using a trimmed mean in some applications. For instance, in the men’s 400m hurdles at the World Championships in 2019, Kyron McMaster finished third in 48.10 seconds. In the 400m hurdles at the Tokyo Olympics, Alison dos Santos finished third in 46.72 s. That’s 2.7% faster.  For women, the 2019 World Championship time was Rushell Clayton’s 53.74 s, compared to Femke Bol’s third-place time of 52.03s in Tokyo; that’s 3.2% faster. 

Anyone got any other ideas for the best way to quantify the effect of the track surface?

[Added later: I got data (from Wikipedia) from recent Olympics and World Championships, and generated the plot that I have now included. The columns are distances (100, 200, and 400m), rows are sex.]


This post is by Phil.


Some open questions in chess

– When played optimally, is pawn race a win for white, black, or a draw?

– Could I beat a grandmaster if he was down a queen? I tried playing Stockfish with it down a Q and a R, and I won easily. (Yeah!) I suspect I could beat it just starting up a queen. But Stockfish plays assuming I’ll play optimally. Essentially it’s just trying to lose gracefully. In contrast, I’m pretty sure the grandmaster would know I’m not good, so he could just complicate the position and tear me apart. Perhaps someone’s already written a chess program called Patzer that plays kinda like me, and then another program called Hustler that can regularly defeat Patzer.

– If I was playing a top player, and my only goal was to last as many moves as possible, and his goal was to beat me in as few moves as possible, how long could I last?

– In bughouse, which is better, 4 bishops or 4 knights?

– How best to set up maharajah to make it balanced? Maybe the non-maharajah team isn’t allowed to promote and they have to win in some prespecified number of moves?

– And then there are the obvious ones:
1. Under perfect play, is the game a draw?
2. How much worse is the best current computer, compared to perfect play?
3. Could a human ever train to play the best computer to a draw? If not, how much worse etc?

– Do you have any good open questions in chess? If so, please share them in the comments.

We were discussing such questions after seeing this amusing article by Tom Murphy on the longest chess game (“There are jillions of possible games that satisfy the description above and reach 17,697 moves; here is one of them”) and also this fun paper comparing various wacky chess engines such as “random_move,” “alphabetical,” and “worstfish” and which begins:
“CCS Concepts: • Evaluation methodologies → Tournaments; • Chess → Being bad at it;
Additional Key Words and Phrases: pawn, horse, bishop, castle, queen, king.” I’ve been told that here’s an accompanying video but I never have the patience to watch videos.

One thing, though. Murphy writes, “Fiddly bits aside, it is a solved problem to maintain a numeric skill rating of players for some game (for example chess, but also sports, e-sports, probably also z-sports if that’s a thing). Though it has some competition (suggesting the need for a meta-rating system to compare them), the Elo Rating System is a simple and effective way to do it.” I know it’s a jokey paper but I just want to remind youall that these rating systems are not magic: you can think of them as mathematical algorithms or as fits of statistical models, but in any case they don’t always make sense, as can be seen from a simple hypothetical example of program A which always beats B, and B always beats C, and C always beats A. Murphy actually discusses this sort of example in his article, so he’s aware of the imperfections of ratings. I just wanted to bring this one up because chess rating is an example of the fallacy of measurement, by which people think that when something is measured, it must represent some underlying reality.

P.S. Also don’t forget Tim Krabbé’s chess records page, which unfortunately hasn’t been updated for over three years (at the time of this writing). Chess games can’t be copyrighted, so the youngest professor nationwide could collect some of this material in a book and put his name on it!

A regression puzzle . . . and its solution

Alex Tabarrok writes:

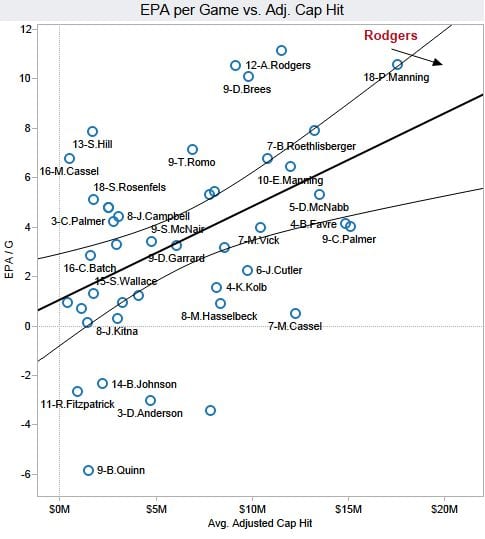
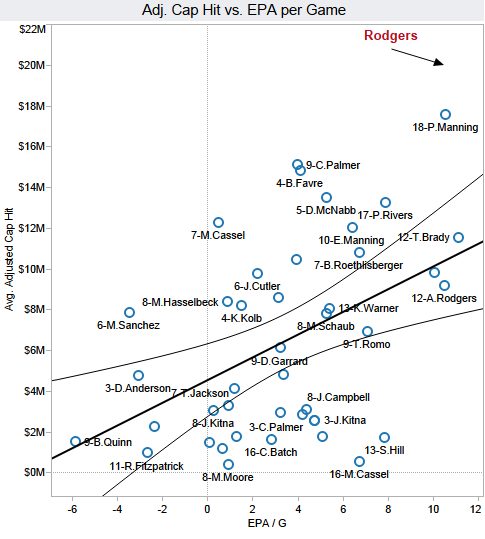
Here’s a regression puzzle courtesy of Advanced NFL Stats from a few years ago and pointed to recently by Holden Karnofsky from his interesting new blog, ColdTakes. The nominal issue is how to figure our whether Aaron Rodgers is underpaid or overpaid given data on salaries and expected points added per game. Assume that these are the right stats and correctly calculated. The real issue is which is the best graph to answer this question:

Brian 1: …just look at this super scatterplot I made of all veteran/free-agent QBs. The chart plots Expected Points Added (EPA) per Game versus adjusted salary cap hit. Both measures are averaged over the veteran periods of each player’s contracts. I added an Ordinary Least Squares (OLS) best-fit regression line to illustrate my point (r=0.46, p=0.002).

Rodgers’ production, measured by his career average Expected Points Added (EPA) per game is far higher than the trend line says would be worth his $21M/yr cost. The vertical distance between his new contract numbers, $21M/yr and about 11 EPA/G illustrates the surplus performance the Packers will likely get from Rodgers.

According to this analysis, Rodgers would be worth something like $25M or more per season. If we extend his 11 EPA/G number horizontally to the right, it would intercept the trend line at $25M. He’s literally off the chart.

Brian 2: Brian, you ignorant slut. Aaron Rodgers can’t possibly be worth that much money….I’ve made my own scatterplot and regression. Using the exact same methodology and exact same data, I’ve plotted average adjusted cap hit versus EPA/G. The only difference from your chart above is that I swapped the vertical and horizontal axes. Even the correlation and significance are exactly the same.

As you can see, you idiot, Rodgers’ new contract is about twice as expensive as it should be. The value of an 11 EPA/yr QB should be about $10M.

Alex concludes with a challenge:

Ok, so which is the best graph for answering this question? Show your work. Bonus points: What is the other graph useful for?

I followed all the links and read all the comments and I have my answer, which is different (although not completely unrelated to) what other people are saying. It’s interesting to see people struggling to work this one out.

But giving my solution right now would be boring, right? So I’ll leave it up for youall to discuss in comments, then in a day or two I’ll post my answer. I will say this, though: it’s not a trick, and I’m not trying to use any football-specific or NFL-specific knowledge.

Enjoy. I’m teaching applied regression and causal inference this fall and spring so it’s great to have examples like this. Although maybe this one’s a bit too complicated for an intro class . . .

P.S. I’d prefer the graphs to just have the names and get rid of those distracting little circles all over the place.

What is a “woman”?

This post is by Phil Price, not Andrew.

As we approach the Olympic Games, this seems like a good time to think about the rules for deciding whether a person is a “woman” when it comes to athletic competition. As I was doing some searches to find some information for the post, I found an excellent piece that puts everything together much better than I would have. Go ahead and read that, then come back here. (The piece is by Christie Aschwanden,  of whom I think very highly; she wrote a book I reviewed here two years ago).

The issue is: if you’re going to have separate divisions for men and women, then you need a way to define “woman.”  A good way of defining this might seem obvious: if the person has a vagina, she’s a she. That’s the way the international sports governing bodies used to do it, but then that was rejected for reasons mentioned in Aschanden’s piece. Well, how about “does the person have two X chromosomes?”  After nixing genitalia as the criterion, this is what they switched to…but then that was rejected for reasons also mentioned in the piece. Currently,  according to the article, “Female athletes who [have] functional testosterone (in other words, not just high testosterone levels, but also functioning receptors that allowed their bodies to respond to the hormone) above a threshold number [are] not eligible to compete unless they [do] something to reduce their testosterone below the threshold.”  (The original sentence is in the past tense, but this is pretty much the current situation too). 

I think it’s safe to say that most people with an interest in how “woman” should be defined for sporting purposes are unhappy with any of the past standards and with the current one. An issue with the current article is, as it says in the article: “People who go through male puberty are taller, have bigger bones and develop greater muscle mass than those who go through female puberty, said William Briner, a sports medicine physician at the Hospital for Special Surgery in Uniondale, New York, during a session on transgender athletes at the American College of Sports Medicine meeting in early June. Men also have more red blood cells than women, and their hearts and lungs are bigger too. Some of these advantages are irreversible [even if testosterone levels are later reduced].”  

Furthermore, although the Olympics focuses only on the best athletes in the world, there’s a need for competition rules that apply at other levels too. High school basketball, for example, needs a way to determine who is eligible to play on the girls’ team. Is it fair for a 17-year-old 6’4″ high school athlete who went through puberty as a male, but then transitioned to female, to be allowed to compete against girls who went through puberty as girls? Viewed one way, being a woman who went through puberty as a male is just another genetic advantage, and we let athletes use their genetic advantages, so there’s no problem with such a person competing on the girls’ team. Viewed another way, it’s not fair to let someone compete as a girl if they got their body by growing up as a boy. 

So what do I think the rule should be? I have no idea. Indeed, I’m not even sure how to think about what the rules are trying to achieve. We have separate competitions for men and women because it would be “unfair” for women to have to compete against men: in most sports the best women wouldn’t stand a chance against the best men, and the average woman wouldn’t stand a chance against the average man. A female sprinter, for instance, would have no chance of reaching the elite level if competing against men. OK, fine…but what about me? I’m a man but I would also have no chance of reaching the elite level if sprinting against other men. Indeed, I would have no chance of reaching the elite level if I were sprinting against women! The fact is, very few people have the genes (and other characteristics) to compete at the elite level. If the point of the rules is to give everyone a reasonable chance to be among the best in the world in a given category, well, that’s not gonna happen, because no matter how you define the categories there will be only a small fraction of people who have what it takes.  By having separate competitions for men and women we can’t really be trying to give “everyone” a chance. So what are we trying to do?

All of this puts me in mind of a statistical principle or worldview that Andrew has mentioned before, that I think he attributes to Don Rubin: most things that we think of as categorical are really continuous. For some purposes (and with some definitions) male/female is indeed categorical — no male can bear a child, for example — but when it comes to innate ability in a sport, what we have is one statistical distribution for men and another statistical distribution for women, and (for most sports) for any reasonable definition of “man” and “woman” the high tail for men will be higher than the high tail for women, but  the bulk of the distributions will overlap. If  Caster Semenya is a woman for sporting purposes, in spite of her XY chromosomes and typically-male testosterone level, then she is at the very top of the sport. If she is a male for sporting purposes, then she is not remotely competitive at the elite level. (Welcome to the club!). Sporting ability is continuous but we have to somehow force people into two categories, assuming we want to continue the current male/female division in competitions. 

It’s said that “hard cases make bad law” but this seems like a sphere in which all of the cases are going to be hard.


This post is by Phil.

The Tampa Bay Rays baseball team is looking to hire a Stan user

Andrew and I have blogged before about job opportunities in baseball for Stan users (e.g., here and here) and here’s a new one. This time it’s the Tampa Bay Rays who are hiring. The job title is “Analyst, Baseball Research & Development” and here are the responsibilities and qualifications:

Responsibilities:
* Build customized statistical modeling tools for accurate prediction and inference for various baseball applications.
* Provide statistical modeling expertise to other R&D Analysts.
* Optimize code to ensure quick and reliable model sampling/optimization.
* Author both technical and non-technical internal reports on your work.

Qualifications:
* Experience with Stan or other probabilistic programming language
* Experience with R or Python
* Deep understanding of the fundamentals of Bayesian Inference, MCMC, and Autocorrelation/Time Series Modeling.
* Start date is flexible. For example, candidates with an extensive amount of remaining time left in an academic program are encouraged to apply immediately.
* Candidates with non-traditional schooling backgrounds, as well as candidates with Advanced degree (Masters or PhD) in Statistics, Data Science, Machine Learning, or a related field are encouraged to apply

That’s just part of the job ad, so I recommend checking out the full posting, which includes important details like the fact that remote work is a possibility.

Here are a few other details I can share that aren’t included in the job ad:

  • The Rays have already been using Stan for years now so you won’t be the only Stan user there.
  • A few years ago a few of us (Stan developers) did some consulting/training work for the Rays and had a great experience. Some of their R&D team members have changed since then but I still know some of the ones there and I highly recommend working with them if you’re interested in baseball.
  • The Rays always have one of the lowest payrolls for their roster and yet they are somehow consistently competitive (they even made the World Series last year!). I’m sure there are multiple reasons for this, but I strongly suspect that the strength of the R&D team you’d be joining is one of them.


The insider-outsider perspective (Jim Bouton example)

One theme that’s come up often here over the years is what the late Seth Roberts called the insider-outsider perspective of “people who have the knowledge of insiders but the freedom of outsiders,” and here’s one of many examples.

I thought about this again after reading this interview by Steven Goldleaf on Bill James Online of Mitch Nathanson, author of biographies of baseball players Dick Allen and Jim Bouton. Bouton, of course, is one of the two authors of the classic Ball Four. Goldleaf quotes Nathanson:

The “outsider within” theme/category is something that really took shape as I [Nathanson] was researching. Yes, I know Dick Young called him a “social leper” but I wasn’t aware of how much he was an outsider his whole life. But not a total outsider – he was a good-looking, all-American-type who would fit in anywhere, at least on first glance, so he was an insider, at least superficially. So that was an interesting dynamic that I saw play out over and over again throughout his life. . . .

I’m actually working on another piece (a longer article) about how Bouton was an “outsider-within” and how that actually helped him see things that other players couldn’t. He had one foot firmly within the inner circle but another foot outside of it and could see things from both perspectives. This is how, I think, he was able to identify the absurdities within the game that those who were fully invested in it (think Pete Rose) just could never hope to see. . . .

Interesting.

Statistical Modeling, Causal Inference, and Social Science gets results!

A few months ago, we posted this job ad from Des McGowan:

We are looking to hire multiple full time analysts/senior analysts to join the Baseball Analytics department at the New York Mets. The roles will involve building, testing, and presenting statistical models that inform decision-making in all facets of Baseball Operations. These positions require a strong background in complex statistics and data analytics, as well as the ability to communicate statistical model details and findings to both a technical and non-technical audience. Prior experience in or knowledge of baseball is not required.

Interested applicants should apply at this link and are welcome to reach out to me ([email protected]) if they have any questions about the role.

More recently, McGowan informed me that one of the people they ultimately hired applied because he saw it here on this blog.

Cool!

The Mets are hiring

Des McGowan writes:

We are looking to hire multiple full time analysts/senior analysts to join the Baseball Analytics department at the New York Mets. The roles will involve building, testing, and presenting statistical models that inform decision-making in all facets of Baseball Operations. These positions require a strong background in complex statistics and data analytics, as well as the ability to communicate statistical model details and findings to both a technical and non-technical audience. Prior experience in or knowledge of baseball is not required.

Interested applicants should apply at this link and are welcome to reach out to me ([email protected]) if they have any questions about the role.

Modeling, data analysis, computation, decision making, communication . . . all the good things.

If they offer you a job, my advice is to try to negotiate something like the contract they gave to Bobby Bonilla.

Who are the culture heroes of today?

When I was a kid, the culture heroes were Hollywood and TV actors, pop musicians, athletes and coaches, historical political and military figures, then I guess you could go down the list of fame and consider authors, artists, scientists and inventors . . . . that’s about it, I think.

Nowadays, we still have actors, athletes, and some historical figures—but it’s my impression that musicians are no longer “rock stars,” as it were. Sure, there are a few famous pop musicians and rappers at any given time, along with legacy figures like Bruce etc., but I don’t feel like musicians are culture heroes the way they used to be. To put it another way: there are individual pop stars, but just a few, not a whole galaxy of them as there used to be.

The big replacement is business executives. 40 or 50 years ago, you’d be hard pressed to name more than two or three of these guys. Lee Iacocca, Steve Jobs, . . . . that was about it. Maybe the guy who owned McDonalds, and some people like Colonel Sanders and Crazy Eddie who advertised on TV. Nowadays, though, there’s a whole pantheon of superstar executives, kind of parallel to the pantheon of Hollywood actors or sports stars. Cuddly executives in the Tom Hanks mode, no-nonsense get-the-job-done Tom Brady types, trailblazing Navratilovas, goofballs, heroes, heels, the whole story. We have executives who some people worship and others think are ridiculously overrated.

That’s part of the point, I guess. Culture heroes and villains don’t stand alone; they’re part of a pantheon of characters as with Olympian gods or a superhero universe, each with his or her unique characteristics. We love (or love to hate) Bill Gates or Elon Musk, not just for their own accomplishments and riches but also for how they fit into this larger story. We can define ourselves in part with who we root for in the Tesla/GM/Volkswagen struggle, or where we fall on the space bounded by corporate normies like Bill Gates, outlaws like John McAfee, and idealists like Richard Stallman. And people like Martin Shkreli and Elizabeth Holmes are not just failed businesspeople; they’re “heels” who we can root against or root for in the latest business throwdown. The particular examples you care about might differ, but in whatever arena you care about, the ever-changing pantheon of execs at the top make for a set of story arcs comparable to those of Joan Crawford and other movie stars from the 1950s.

As noted above, we also still have actors, athletes, and historical figures. There have been some changes here. The “actors” category used to be some mix of movie stars, TV stars, talk show hosts, and sex symbols. These are still there, but I feel like it’s blurred into a more general “celebrity” category. The “athletes” category seems similar to before, even if it’s not always the same sports being represented. Similarly with the historical figures: we’re now more multicultural about it, but I think it’s the same general feeling as before.

Also, I feel like we hear more about politicians than we used to. Back in the 1970s you’d hear about whoever was the current president, and some charismatic others such as Ronald Reagan, and . . . that was about it. I don’t recall the Speaker of the House or the Senate majority or minority leader being household names. I guess that part of this was that congress had one-party control back then, which gave the party leaders less important as individuals.

P.S. The above could use some systematic social science thought and measurement, but I thought there’d be some value in starting by throwing these ideas out there.

P.P.S. Carlos reminds us that we had a related discussion a few months aga. I guess it really is time for me to move from the speculation to the social-science stage of the investigation already.

“Maybe the better analogy is that these people are museum curators and we’re telling them that their precious collection of Leonardos, which they have been augmenting at a rate of about one per month, include some fakes.”

Someone sent me a link to a recently published research paper and wrote:

As far as any possible coverage on your blog goes, this one didn’t come from me, please. It just looks… baffling in a lot of different ways.

OK, so it didn’t come from that person. I read the paper and replied:

Oh, yes, the paper is ridiculous. For a paper like that to be published by a scientific society . . . you could pretty much call it corruption. Or scientism. Or numerology. Or reification. Or something like that. I also made the mistake of doing a google search and finding a credulous news report on it.

Remember that thing I said a few years ago: In journals, it’s all about the wedding, never about the marriage.

For the authors and the journal and the journal editor and the twitter crowd, it’s all just happy news. The paper got published! The good guys won! Publication makes it true.

And, after more reflection:

I keep thinking about the couathors on the project and the journal editors and the reviewers . . . didn’t anyone want to call Emperor’s New Clothes on it? But then I think that I’ve seen some crappy PhD theses, really bad stuff where everyone on the committee is under pressure to pass the person, just to get the damn thing over with. And of course if you give the thesis a passing grade, you’re a hero. Indeed, the worse the thesis, the more grateful the student and the other people on the committee will be! [Just to be clear, most of the Ph.D. theses I’ve seen have been excellent. But, yes, there are some crappy ones too. That’s just the way it is! It’s not just a problem with students. I’ve taught some crappy classes too. — ed.]

So in this case I guess it goes like this: A couple of researchers have a clever, interesting, and potentially important idea. I’ll grant them that. Then they think about how to study it. It’s hard to study social science processes, where so much is hidden! So you need to find some proxy, they come up with some ideas that might be a little offbeat, but maybe they’ll work. . . . then they get the million data points, they do lots of hard work, they get a couple more coauthors and write a flashy paper–that’s not easy either!–maybe it gets rejected by a couple journals and gets sent to this journal.

Once it gets to there, ok, there are a couple possibilities here. One possibility is that one of the authors has a personal or professional connection to someone on the editorial board and so it gets published. I’m not saying it’s straight baksheesh here: they’re friends, they like the same sort of research, they recognize the difficulty of doing this sort of work and even if it’s not perfect it’s a step forward etc etc. The other possibility is they send the paper in cold and they just get lucky: they get an editor and reviewers who like this sort of high-tech social science stuff–actually it all seems a bit 2010-era to me, but, hey, if that’s what floats their boat, whatever.

Then, once the paper’s accepted, it’s happy time! How wonderful for the authors’ careers! How good for justice! How wonderful of the journal, how great for science, etc.

It’s like, ummm, I dunno, let’s say we’re all kinda sad that there have been over 50 Super Bowls and the Detroit Lions have never won it. They’ve never even been in the Super Bowl. But if they were, if they had some Cinderella story of an inspiring young QB and some exciting receivers, a defense that never gives up, a quirky kicker, a tough-but-lovable head coach, and an owner who wasn’t too evil, then, hey, wouldn’t that be a great story! Well, if you’re a journal editor, you not only get to tell the story, you get to write it too! So I guess maybe the NBA would be a better analogy, given that they say it’s scripted . . .

My anonymous correspondent replied:

I just have no idea where to start with this stuff. I find it to be profoundly confused, conceptually. For one thing, the idea that we should take seriously [the particular model posited in the article] is deeply essentialist. I can imagine situations in which is the case, but I can also imagine situations in which it isn’t the case because of interacting factors from people’s life history. . . . That’s how social processes work! But people do this weird move where they assume any discrepant outcome like that must be the result of one particular stage in the process rather than entrenched structures, which, to my mind, really misses the point of how this stuff works.

So I’m just so skeptical of that idea in the first place. And to then claim to have found evidence for it just because of these very indirect analyses?

I responded:

I’m actually less interested in the scientific claims of this paper than in the “sociology” of how it gets accepted etc. One thing that I was thinking of is that, to much of the scientific establishment, the fundamental unit of science is the career. And a paper in a solid journal written by a young scholar . . . what a great way to start a career. The establishment people [yes, I’m “establishment” too, just a different establishment — ed.] can’t imagine why someone like you or me would criticize a published scientific paper—it’s so destructive! Not destructive toward the research hypothesis. Destructive to the career. For us to criticize, this could only be from envy or racism or because we’re losers or whatever. Of course, they don’t seem to recognize the zero-sumness of all this: someone else’s career never gets going because they don’t get the publication, etc.

Anyway, that’s my take on it. To the Susan Fiskes of the world, what we are doing is plain and simple vandalism, terrorism even. A career is a precious vase, taking years to build, and then we just smash it. From that perspective, you can see that criticisms are particularly annoying when they are scientifically valid. After all, a weak criticism can be brushed aside. But a serious criticism . . . that could break the damn vase.

Maybe the better analogy is that these people are museum curators and we’re telling them that their precious collection of Leonardos, which they have been augmenting at a rate of about one per month, include some fakes. Or, maybe one or two of the Leonardos might be of somewhat questionable authenticity. But, don’t worry, the vast majority of their hundreds of Leonardos are just fine. Nothing to see here, move along. Anyway, such a curator could well be more annoyed, the more careful and serious the criticism is.

P.S. The story’s also interesting because the problems with this research have nothing to do with p-hacking, forking paths, etc. Really no “questionable research practices” at all—unless you want to count the following: creating a measurement that has just about nothing to do with what you’re claiming to measure, setting up a social science model that makes no sense, and making broad claims from weak evidence. Just the usual stuff. I don’t think anyone was doing anything wrong on purpose. More than anyone else, I blame the people who encourage, reward, and promote this sort of work. I mean, don’t get me wrong, speculation is fine. Here’s a paper of mine that’s an unstable combination of simple math and fevered speculation. The problem is when the speculation is taken as empirical science. Gresham, baby, Gresham.

I ain’t the lotus

Some people wanted me to resolve this Minecraft dispute. But it’s so far outside my areas of expertise and interest that I have no plans to look into it. My reason for posting was that I thought it could interest some of the blog readership, not necessarily the same readers who are interested in posts on baseball, football, and chess.

I expect that, one way or another, this will get sorted out within the Minecraft community, in the same way that various open questions have been resolved within scientific and scholarly communities, via some combination of analysis, discussion, and replication. But I expect the controversy will never go away. Consider some examples from different areas of science and society:

Cold fusion. People were skeptical even at first, and now only a few physicists think it’s real. But there are some who continue to work in the area.

Embodied cognition. Was believed by mainstream psychology, but now I think it’s a minority view, but it still has some loud defenders as well as a pretty big group of researchers who, whether or not they believe in it, don’t want to think too carefully about the implication of the failed replications for scientific knowledge more generally.

Hot hand. Most social scientists thought the hot hand was a fallacy, then the claimed fallacy was revealed to itself be based on statistical fallacies, now I’d say that people are divided on whether there is a hot hand or how important it is.

Global warming. Believed by vast majority of scientists, but some skeptics remain, and this is also connected to politics.

Beauty and sex ratio. Most people don’t care about this one at all, but I suspect that many people who do care are believers, despite the lack of any good evidence. There’s some selection bias here, because the sorts of people who care about this in the first place will include many people who are committed to the underlying theory.

Claims of massive fraud in 2020 election. Lots of people still express belief in this, despite the lack of any good evidence.

The point is, all these topics have some remaining controversy, for better or worse. Controversy can go away within informed subsets of the population but remain elsewhere. To some extent, issues can be resolved not just by reanalysis but by new data. In this case, I guess it would be for this person to do another speedrun under controlled conditions? But, again, when it comes to videogames I have no idea.

“Dream Investigation Results: Official Report by the Minecraft Speedrunning Team”

It’s almost Christmas, which makes us think of toys and presents, like . . . videogames for the kids and young adults in your life.

And we have a story for you, all about ethics in video game speedrunning.

Matt Drury writes:

Recently a top player of Minecraft has been exposed as a cheater using a very thorough and well presented statistical analysis of their luck during their play sessions. I was really impressed with the analysis, their dedication to fairness and applying multiple corrections. There’s even implicit attention to the garden of forking paths.

Here’s their paper on the approach and results.

They also published a video with an overview of the methods and results (less details of course).

I know nothing about Minecraft except that it’s a videogame that’s popular with kids. But I guess this might interest some of our readership?

I asked a local expert, who characterized the above-linked paper as “trivial but impressive.” The local expert was not so impressed by the rebuttal offered by the player accused of cheating.

P.S. More here on how this sort of dispute can be resolved.

A new hot hand paradox

1. Effect sizes of just about everything are overestimated. Selection on statistical significance, motivation to find big effects to support favorite theories, researcher degrees of freedom, looking under the lamp-post, and various other biases. The Edlin factor is usually less than 1. (See here for a recent example.)

2. For the hot hand, it’s the opposite. Correlations between successive shots are low, but, along with Josh Miller and just about everybody else who’s played sports, I think the real effect is large.

How to reconcile 1 and 2? The answer has little to do with the conditional probability paradox that Miller and Sanjurjo discovered, and everything to do with measurement error.

Here’s how it goes. Suppose you are “hot” half the time and “cold” half the time, with Pr(success) equal to 0.6 in your hot spells and 0.4 in your cold spells. Then the probability of two successive shots having the same result is 0.6^2 + 0.4^2 = 0.52. So if you define the hot hand as the probability of success conditional on a previous success, minus the probability of success conditional on a previous failure, you’ll think the effect is only 0.04, even though in this simple model the true effect is 0.20.

This is known as attenuation bias in statistics and econometrics and is a well-known effect of conditioning on a background variable that is measured with error. The attenuation bias is particularly large here because a binary outcome is about the noisiest thing there is. This application of attenuation bias to the hot hand is not new (it’s in some of the hot hand literature that predates Miller and Sanjurjo, and they cite it); I’m focusing on it here because of its relevant to effect sizes.

So one message here is that it’s a mistake to define the hot hand in terms of serial correlation (so I disagree with Uri Simonsohn here).

Fundamentally, the hot hand hypothesis is that sometimes you’re hot and sometimes you’re not, and that this difference corresponds to some real aspect of your ability (i.e., you’re not just retroactively declaring yourself “hot” just because you made a shot). Serial correlation can be an effect of the hot hand, but it would be a mistake to define serial correlation as the hot hand.

One thing that’s often left open in hot hand discussions is to what extent the “hot hand” represents a latent state (sometimes you’re hot and sometimes you’re not, with this state unaffected by your shot) and to what extent it’s causal (you make a shot, or more generally you are playing well, and this temporarily increases your ability, whether because of better confidence or muscle memory or whatever). I guess it’s both things; that’s what Miller and Sanjurjo say too.

Also, remember our discussion from a couple years ago:

The null model is that each player j has a probability p_j of making a given shot, and that p_j is constant for the player (considering only shots of some particular difficulty level). But where does p_j come from? Obviously players improve with practice, with game experience, with coaching, etc. So p_j isn’t really a constant. But if “p” varies among players, and “p” varies over the time scale of years or months for individual players, why shouldn’t “p” vary over shorter time scales too? In what sense is “constant probability” a sensible null model at all?

I can see that “constant probability for any given player during a one-year period” is a better model than “p varies wildly from 0.2 to 0.8 for any player during the game.” But that’s a different story.

Ability varies during a game, during a season, and during a career. So it seems strange to think of constant p_j as a reasonable model.

OK, fine. The hot hand exists, and estimates based on correlations will dramatically underestimate it because attenuation bias.

But then, what about point 1 above, that the psychology and economics research literature (not about the hot hand, I’m talking here about applied estimates of causal effects more generally) typically overestimates effect size, sometimes by a huge amount. How is the hot hand problem different from all other problems? In all other problems, published estimates are overestimates. But in this problem, the published estimates are too small. Attenuation bias happens in other problems, no? Indeed, I suspect that one reason econometricians have been so slow to recognize the importance of type M errors and the Edlin factor is that they’ve been taught about attenuation bias and they’ve been trained to believe that noisy estimates are too low. From econometrics training, it’s natural to believe that your published estimates are “if anything, too conservative.”

The difference, I think, is that in most problems of policy analysis and causal inference, the parameter to be estimated is clearly defined, or can be clearly defined. In the hot hand, we’re trying to estimate something latent.

To put it another way, suppose the “true” hot hand effect really is a large 0.2, with your probability going from 40% to 60% when you go from cold to hot. There’s not so much that can be done with this in practice, given that you never really know your hot or cold state. So a large underlying hot hand effect would not necessarily be accessible. That doesn’t mean the hot hand is unimportant, just that it’s elusive. Concentration, flow, etc., these definitely seem real. It’s the difference between estimating a particular treatment effect (which is likely to be small) and an entire underlying phenomenon (which can be huge).

What happens to the median voter when the electoral median is at 52/48 rather than 50/50?

Here’s a political science research project for you.

Joe Biden got about 52 or 53% of the two-party vote, which was enough for him to get a pretty close win in the electoral college. As we’ve discussed, 52-48 is a close win by historical or international standards but a reasonably big win in the context of recent U.S. politics, where the Democrats have been getting close to 51% in most national elections for president and congress. I’m not sure how the congressional vote ended up, but I’m guessing it’s not far from 51/49 also.

Here’s the background. From a combination of geography and gerrymandering, Republicans currently have a structural edge in races for president and congress: Democrats need something around 52% of the two-party vote to win, while Republicans can get by with 49% or so. For example, in 2010 the Republicans took back the House of Representatives with 53.5% of the two-party vote, but they maintained control in the next three elections with 49.3%, 52.9%, and 50.6%. The Democrats regained the House in 2018 with 54.4% of the two-party vote.

And it looks like this pattern will continue, mostly because Democrats continue to pile up votes in cities and suburbs and also because redistricting is coming up and Republicans control many key state governments.

And here’s the question. Assuming this does continue, so that Republicans can aim for 49% support knowing that this will give them consistent victories at all levels of national government, while Democrats need at least 52% to have a shot . . . how does this affect politics indirectly, at the level of party positioning?

When it comes to political influence, the effect is clear: as long as the two parties’ vote shares fluctuate in the 50% range, Republicans will be in power for more of the time, which directly addresses who’s running the government but also has indirect effects: if the Republicans are confident that in a 50/50 nation they’ll mostly stay in power, this is a motivation for them to avoid compromise and go for deadlock when Democrats are in charge, on the expectation that if they wait a bit, the default is that they’ll come back and win. (A similar argument held in reverse after 2008 among Democrats who believed that they had a structural demographic advantage.)

But my question here is not about political tactics but rather about position taking. If you’re the Democrats and you know you need to regularly get 52% of the vote, you have to continually go for popular positions in order to get those swing voters. There’s a limit to how much red meat you can throw to your base without scaring the center. Conversely, if all you need is 49%, you have more room to maneuver: you can go for some base-pleasing measures and take the hit among moderates.

There’s also the question of voter turnout. It can be rational, even in the pure vote-getting sense, to push for positions that are popular with the base, because you want that base to turn out to vote. But this should affect both parties, so I don’t think it interferes with my argument above. How much should we expect electoral imbalance to affect party positioning on policy issues?

The research project

So what’s the research project? It’s to formalize the above argument, using election and polling data on specific issues to put numbers on these intuitions.

As indicated by the above title, a first guess would be that, instead of converging to the median voter, the parties would be incentivized to converge to the voter who’s at the 52nd percentile of Republican support.

The 52% point doesn’t sound much different than the 50% point, but, in a highly polarized environment, maybe it is! If 40% of voters are certain Democrats, 40% are certain Republicans, and 20% are in between, then we’re talking about a shift from the median to the 60th percentile of unaffiliated voters. And that’s not nothing.

But, again, such a calculation is a clear oversimplification, given that neither party is anything close to that median. Yes, the are particular issues where one party or the other is close to the median position of Americans, but overall the two parties are well separated ideologically, which of course is a topic of endless study in the past two decades (by myself as well as many others). The point of this post is that, even in a polarized environment, there’s some incentive to appeal to the center, and the current asymmetry of the electoral system at all levels would seem to make this motivation much stronger for Democrats than for Republicans. Which might be one reason why Joe Biden’s talking about compromise but you don’t hear so much of that from the other side.

P.S. As we discussed the other day, neither candidate seemed to make much of a play for the center during the campaign. It seemed to me (just as a casual observer, without having made a study of the candidates’ policy positions and statements) that in 2016 both candidates moved to the center on economic issues. But in 2020 it seemed that Trump and Biden were staying firmly to the right and left, respectively. I guess that’s what you do when you think the voters are polarized and it’s all about turnout.

Relatedly, a correspondent writes:

Florida heavily voted for 15 minimum wage yet went to Trump. Lincoln project tried to get repubs and didnt work. florida voted for trump because of trump, not because of bidens tax plan.

To which I reply: Yeah, sure, but positioning can still work on the margin. Maybe more moderate policy positions could’ve moved Biden from 52.5% to 53% of the two-party vote, but then again he didn’t need it.

P.P.S. Back in his Baseball Abstract days, Bill James once wrote something about the different strategies you’d want if you’re competing in an easy or a tough decision. In the A.L. East in the 1970s, it generally took 95+ wins to reach the playoffs. As an Orioles fan, I remember this! In the A.L. West, 90 wins were often enough to do the trick. Bill James conjectured that if you’re playing in an easier division, it could be rational to go for certain strategies that wouldn’t work in a tougher environment where you might need regular-season 100 wins. He didn’t come to any firm conclusions on the matter, and I’m not really clear how important the competitiveness of the division is, given that it’s not like you can really target your win total. And none of this matters much now that MLB has wild cards.

P.P.P.S. Senator Lindsey Graham is quoted as saying on TV, “If Republicans don’t challenge and change the U.S. election system, there will never be another Republican president elected again,” but it’s hard for me to believe that he really thinks this. As long as the Republican party doesn’t fall apart, I don’t see why they can’t win 48% or even 50% or more in some future presidential races.

It seems nuts for a Republican to advocate that we “challenge and change the U.S. election system,” given the edge it’s currently giving them. In the current political environment, every vote counts, and the winner-take-all aggregation of votes by states and congressional districts is a big benefit to their party.

My theory of why TV sports have become less popular

There’s been a lot of discussion recently about declining viewership for TV sports. Below I’ll link to a news article discussing various possible explanations, but first I want to share my theory, which is that we’re watching less sports because we’re talking about sports less, and we’re talking about sports less because we’re mixing with other people less.

My theory

The World Series recently ended. In normal times, we’d run across people at work or at school or on the street, and sports would come up in conversation. Are the Dodgers finally gonna win it all? Everybody hates the Astros. Is LeBron now officially the goat? Etc. The sports is as good as it always is, but we’re more motivated to watch the game if we’ve been talking about it for the past few days. And it’s not even just face-to-face conversations. There’s also been less sports coverage in the newspaper.

Some other theories

Here are some other theories, along with some numbers courtesy of Kevin Draper writing in the New York Times:

TV Ratings for Many Sports Are Down. Don’t Read Too Much Into It Yet. . . .

Ratings for the N.B.A. finals were down 49 percent, and the N.H.L.’s Stanley Cup finals were down a whopping 61 percent. Baseball, golf, tennis, horse racing and other sports have all seen huge declines. Even the usually untouchable N.F.L. was down 13 percent through Week 5. . . .

Since each restarted play, the N.B.A. playoffs, N.H.L. playoffs, Major League Baseball regular season and playoffs, United States Open tennis, United States Open golf, Kentucky Derby, Preakness and college football have all had ratings declines of at least 25 percent compared with 2019.

In a normal year, the ratings for a league might be up or down a few percentage points; anything approaching double digits is a pretty big deal. Ratings drops like these are rare for a single league or event, and unheard-of across most of the entire sports television landscape at once. . . .

He then discusses possible reasons for the ratings drop:

To begin, fewer people are turning on their televisions. Compared with September 2019, total viewership across all television was down 9 percent in September 2020 . . .

There are also standard cyclical trends that affected some sports. August 2019 viewership was down 9 percent from April 2019 viewership, as people watch less television in summer than in spring. This year, that hurt leagues like the N.B.A. and N.H.L., which typically end before the summer. . . .

When sports have been played during the evening, they have faced unusually tough competition. Viewership of cable news in early October was up 79 percent compared with last year . . .

There has also been increased competition within sports. . . .

And, of course, politics gets into the act:

There are a lot of people grafting their preferred political narrative onto the N.B.A.’s ratings decline. Senator Ted Cruz, Republican of Texas, sparred with the Dallas Mavericks owner Mark Cuban about ratings on Twitter. . . .

There are a few problems with asserting that political or social justice stances have affected N.B.A. viewership. . . . Much of the polling on the issue is poorly done, but the main takeaway from the better polls is that there is little evidence fans are turning away from the N.B.A. for political reasons. . . .

Also, nearly every other sport also saw huge declines even though they did not embrace demonstrations in the same way. As some people on social media joked after seeing the low ratings for the Kentucky Derby and the Preakness, did people turn off the television because the horses knelt during the national anthem? . . .

Bill James is back

I checked Bill James Online the other day and it’s full of baseball articles! I guess now that he’s retired from the Red Sox, he’s free to share his baseball thoughts to all. Cool!

He has 8 posts in the past week or so, which is pretty impressive given that each post has some mixture of data, statistical analysis, and baseball thinking. It’s hard for me to imagine he can keep this up—sure, I do a post a day or so, but most of my posts don’t include original statistical analysis!—but he should go for it as long as he can. Keep the momentum going.

James’s most recent post (at the time of this writing) begins:

Double Plays and Stolen Base Prevention; these things keep the game under control. Our first task today is to estimate how many runs each team has prevented by turning the Double Play. . . .

The 1941 Yankees turned 196 Double Plays. Had they been just average at turning the double play we would have expected them to turn 151, which is an above-average average; the average over time is 139. (The team which would have been expected to turn the most double plays, for whatever this is worth, is the 1983 California Angels, who could have been expected to turn 202 Double Plays, since (a) the team gave up a huge number of hits, and (b) they had an extreme ground ball staff. The Angels actually turned 190 Double Plays, only six fewer than the 1941 Yankees, but 12 below expectation in their case.) . . .

I made a decision earlier that I would use three standard deviations below the norm as the zero-standard in an area in which higher numbers represented excellence, and four standard deviations below the norm as the zero-standard in an area in which higher numbers represented failure. . . .

This was a questionable decision, in the construction of the system, and we’ll revisit it at an appropriate point, but for now, I’m proceeding with 3 standard deviations below the norm as the zero-value standard for double plays. The standard deviation for the 1940s is 16.12—another questionable choice in there, by the way—so three standard deviations below the norm would be 52 double plays. . . .

I just looove this, not so much the baseball and the statistical analysis—that’s all fine—what I really love is the style. It’s just sooo Bill James. I’m reminded not so much of previous Bill James things I’ve read, but of Veronica Geng’s affectionate parody of the Bill James abstracts from back in the 1980s. Reading Geng’s story takes me back to what it felt like then, seeing the new Abstract appear every spring. The Bill James Abstract was pretty much the only statistics out there, period. There was no Freakonomics, there were no data journalists, etc. And that style! It’s hard to pick out exactly what James is doing here, but the style is unmistakably his. Good to see that some things never change.

Further reading

Also relevant:

A Statistician Rereads Bill James

Jim Albert’s blog on baseball statistics

Bill James does model checking

“Faith means belief in something concerning which doubt is theoretically possible.”

A collection of quotes from William James that all could’ve come from Bill James

P.S. I came across this post. Dude should learn about Bayes and partial pooling!