Crypto scam social science thoughts: The role of the elite news media and academia

Campos quotes from one of the many stories floating around regarding ridiculous cryptocurrency scams.

I’m not saying it should’ve been obvious in retrospect that crypto was a scam, just that (a) it always seemed that it could be a scam, and (b) for awhile there have been many prominent people saying it was a scam. Again, prominent people can be in error; what I’m getting at is that the potential scamminess was out there.

The usual way we think about scams is in terms of the scammers and the suckers, and also about the regulatory framework that lets people get away with it.

Here, though, I want to talk about something different, which is the role of outsiders in the information flow. For crypto, we’re talking about trusted journalistic intermediaries such as Michael Lewis or Tyler Cowen who were promoting or covering for crypto.

There were lots of reasons for respected journalists or financial figures to promote crypto, including political ideology, historical analogies financial interest, FOMO, bandwagon-following, contrarianism, and plain old differences of opinion . . . pretty much the same set of reasons for respected journalists or financial figures to have been crypto-skeptical!

My point here is not that I knew better than the crypto promoters—yes, I was crypto-skeptical but not out of any special knowledge—; rather, it’s that the infrastructure of elite journalism was, I think, crucial to keeping the bubble afloat. Sure, crypto had lots of potential just from rich guys selling to each other and throwing venture capital at it, and suckers watching Alex Jones or whatever investing their life savings, but elite media promotion took it to the next level.

It’s not like I have any answers to this one. There were skeptical media all along, and I can’t really fault the media for spotting a trend that was popular among richies and covering it.

I’m just interested in these sorts of conceptual bubbles, whether they be financial scams or bad science (ovulation and voting, beauty and sex ratio, ESP, himmicanes, nudges, UFOs, etc etc etc), and how they can stay afloat in Wiley E. Coyote fashion long after they’ve been exposed.

Crypto is different from Theranos or embodied cognition, I guess, in that it has no inherent value and thus can retain value purely as part of a Keynesian beauty context, whereas frauds or errors that make actual scientific or technological claims can ultimately be refuted. Paradoxically, crypto’s lack of value—actually, its negative value, given its high energy costs—can make it a more plausible investment than businesses or ideas that could potentially do something useful if their claims were in fact true.

P.S. More here from David Morris on the role of the elite news media in this story.

The authors of research papers have no obligation to share their data and code, and I have no obligation to believe anything they write.

Michael Stutzer writes:

This study documents substantial variability in different researchers’ results when they use the same financial data set and are supposed to test the same hypotheses. More generally, I think the prospect for reproducibility in finance is worse than in some areas, because there is a publication bias in favor of a paper that uses a unique dataset provided by a firm. Because this is proprietary data, the firm often makes the researcher promise not to share the data with anybody, including the paper’s referees.

Read the leading journals’ statements carefully and you find that they don’t strictly require sharing.

Here is the statement for authors made by the Journal of Financial Econometrics: “Where ethically and legally feasible, JFEC strongly encourages authors to make all data and software code on which the conclusions of the paper rely available to readers. We suggest that data be presented in the main manuscript or additional supporting files, or deposited in a public repository whenever possible.”

In other words, an author wouldn’t have to share a so-called proprietary data set as defined above, even with the papers’ referees. What is worse, the leading journals not only accept these restrictions, but seem to favor such work over what is viewed as more garden-variety work that employs universally available datasets.

Intersting. I think it’s just as bad in medical or public health research, but there the concern is sharing confidential information. Even in settings where it’s hard to imagine that the confidentiality would matter.

As I’ve said in other such settings, the authors of research papers have no obligation to share their data and code, and I have no obligation to believe anything they write.

That is, my preferred solution is not to nag people for their data, it’s just to move on. That said, this strategy works fine for silly examples such as fat arms and voting, or the effects of unionization on stock prices, but you can’t really follow it for research that is directly relevant to policy.

When I said, “judge this post on its merits, not based on my qualifications,” was this anti-Bayesian? Also a story about lost urine.

Paul Alper writes, regarding my post criticizing an epidemiologist and a psychologist who were coming down from the ivory tower to lecture us on “concrete values like freedom and equality”:

In your P.P.S. you write,

Yes, I too am coming down from the ivory tower to lecture here. You’ll have to judge this post on its merits, not based on my qualifications. And if I go around using meaningless phrases such as “concrete values like freedom and equality,” please call me on it!

While this sounds reasonable, is it not sort of anti-Bayes? By that I mean your qualifications represent a prior and the merits the (new) evidence. I am not one to revere authority but deep down in my heart, I tend to pay more attention to a medical doctor at the Mayo Clinic than I do to Stella Immanuel. On the other hand, decades ago the Mayo Clinic misplaced (lost!) a half liter of my urine and double charged my insurance when getting a duplicate a few weeks later.

Alper continues:

Upon reflection—this was over 25 years ago—a half liter of urine does sound like an exaggeration, but not by much. The incident really did happen and Mayo tried to charge for it twice. I certainly have quoted it often enough so it must be true.

On the wider issue of qualifications and merit, surely people with authority (degrees from Harvard and Yale, employment at the Hoover Institution, Nobel Prizes) are given slack when outlandish statements are made. James Watson, however, is castigated exceptionally precisely because of his exceptional longevity.

I don’t have anything to say about the urine, but regarding the Bayesian point . . . be careful! I’m not saying to make inferences or make decisions solely based on local data, ignoring prior information coming from external data such as qualifications. What I’m saying is to judge this post on its merits. Then you can make inferences and decisions in some approximately Bayesian way, combining your judgment of this post with your priors based on your respect for my qualifications, my previous writings, etc.

This is related to the point that a Bayesian wants everybody else to be non-Bayesian. Judge my post on its merits, then combine with prior information. Don’t double-count the prior.

How many Americans drink alcohol? And who are they?

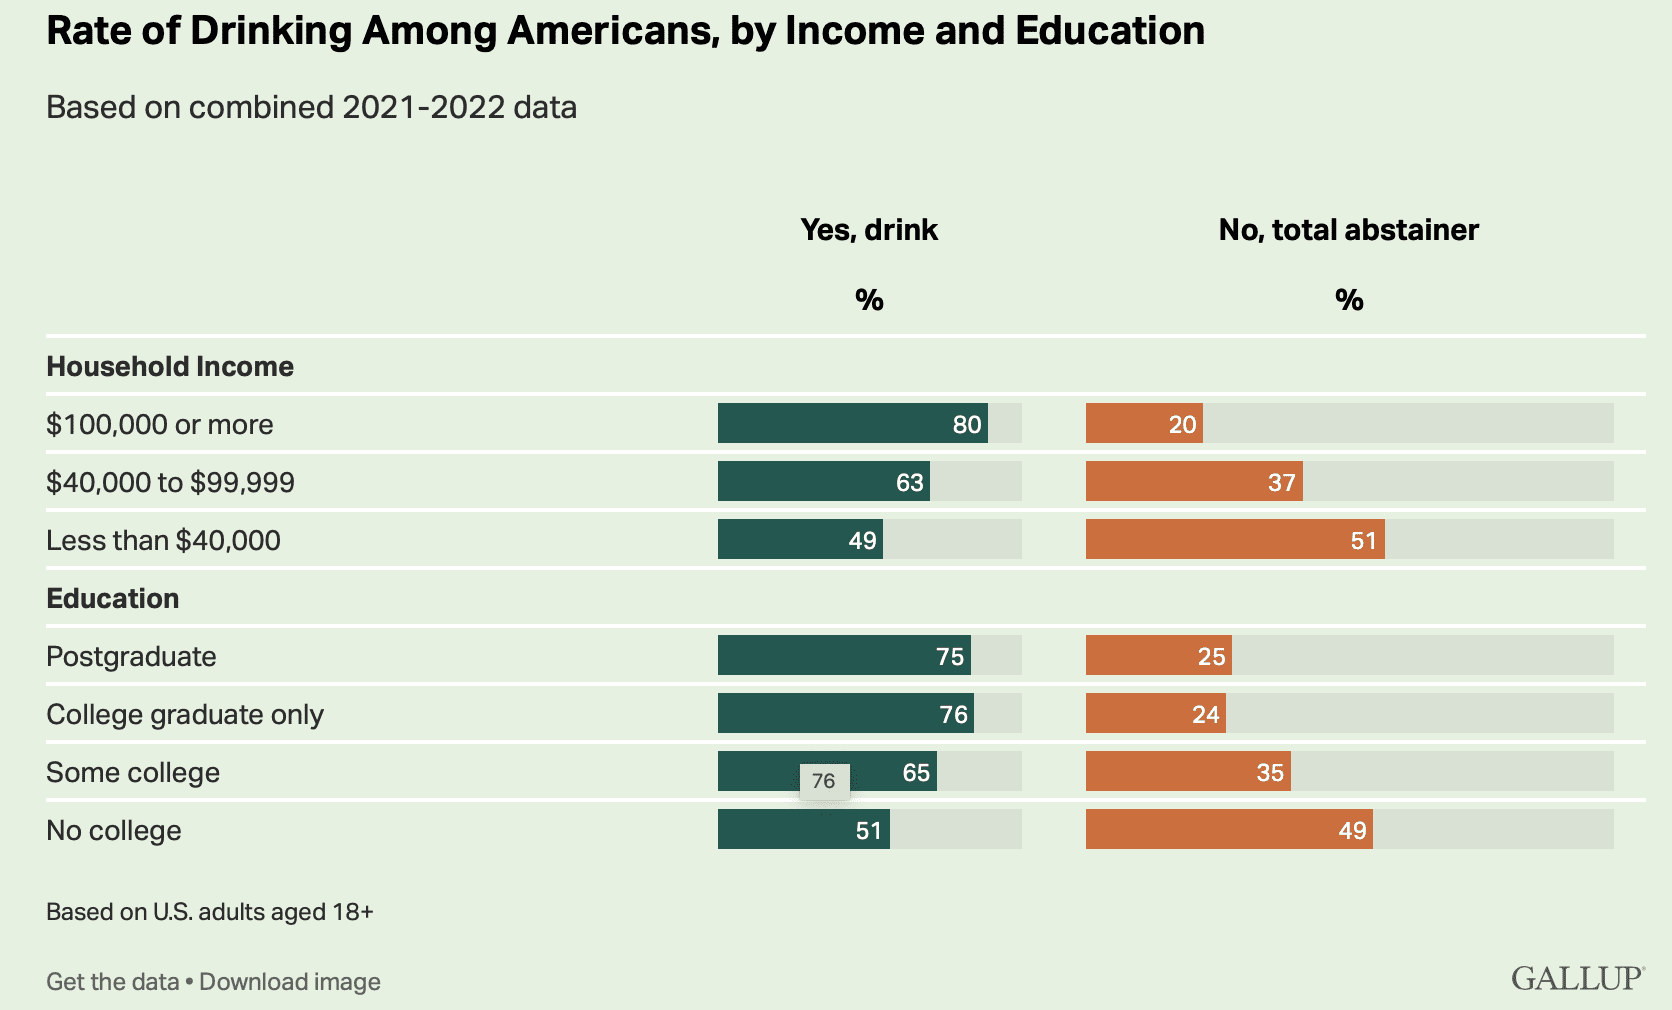
Following up on yesterday’s post, I was wondering how many Americans drink. A quick google led to this page from Gallup. The overall rate has been steady at a bit over 60% for decades:

And the graph at the top breaks things down by income. The richies are much more likely to drink than the poors. I guess there’s something to that stereotype of the country club.

Chris Chambers’s radical plan for Psychological Science

Someone pointed me to this Vision Statement by Chris Chambers, a psychology professor who would like to edit Psychological Science, a journal that just a few years ago was notorious for publishing really bad junk science. Not as bad as PNAS at its worst, perhaps, but pretty bad. Especially because they didn’t just publish junk, they actively promoted it. Indeed, as late as 2021 the Association for Psychological Science was promoting the ridiculous “lucky golf ball” paper they’d published back in the bad old days of 2010.

So it does seem that the Association for Psychological Science and its journals are ripe for a new vision.

See here for further background.

Chambers has a 12-point action plan. It’s full of details about Accountable Replications and Exploratory Reports and all sorts of other things that I don’t really know about, so if you’re interested I recommend you just follow the link and take a look for yourself.

My personal recommendation is that authors when responding to criticism not be allowed to claim that the discovery of errors “does not change the conclusion of the paper.” Or, if authors want to make that claim, they should be required to make it before publication, a kind of declaration of results independence. Something like this: “The authors attest that they believe their results so strongly that, no matter what errors are found in their data or analysis, they will not change their beliefs about the results.” Just get it out of the way already; this will save everyone lots of time that might otherwise be spent reading the paper.

Why does education research have all these problems?

A few people pointed me to a recent news article by Stephanie Lee regarding another scandal at Stanford.

In this case the problem was an unstable mix of policy advocacy and education research. We’ve seen this sort of thing before at the University of Chicago.

The general problem

Why is education research particularly problematic? I have some speculations:

1. We all have lots of experience of education and lots of memories of education not working well. As a student, it was often clear to me that things were being taught wrong, and as a teacher I’ve often been uncomfortably aware of how badly I’ve been doing the job. There’s lots of room for improvement, even if the way to get there isn’t always so obvious. So when authorities make loud claims of “50% improvement in test scores,” this doesn’t seem impossible, even if we should know better than to trust them.

2. Education interventions are difficult and expensive to test formally but easy and cheap to test informally. A formal study requires collaboration from schools and teachers, and if the intervention is at the classroom level it requires many classes and thus a large number of students. Informally, though, we can come up with lots of ideas and try them out in our classes. Put these together and you get a long backlog of ideas waiting for formal study.

3. No matter how much you systematize teaching—through standardized tests, prepared lesson plans, mooks, or whatever—, the process of learning still occurs at the individual level, one student at a time. This suggests that effects of any interventions will depend strongly on context, which in turn implies that the average treatment effect, however defined, won’t be so relevant to real-world implementation.

4. Continuing on that last point, the big challenge of education is student motivation. Methods for teaching X can typically be framed as some mix of, Methods for motivating students to want to learn X, and Methods for keeping students motivated to practice X with awareness. These things are possible, but they’re challenging, in part because of the difficulty of pinning down “motivation.”

5. Education is an important topic, a lot of money is spent on it, and it’s enmeshed in the political process.

Put these together and you get a mess that is not well served by the traditional push-a-button, take-a-pill, look-for-statistical-significance model of quantitative social science. Education research is full of people who are convinced that their ideas are good, with lots of personal experience that seems to support their views, but with great difficulty in getting hard empirical evidence, for reasons explained in items 2 and 3 above. So you can see how policy advocates can get frustrated and overstate the evidence in favor of their positions.

The scandal at Stanford

As Kinsley famously put it, the scandal is isn’t what’s illegal, the scandal is what’s legal. It’s legal to respond to critics with some mixture of defensiveness and aggression that dodges the substance of the criticism. But to me it’s scandalous that such practices are so common in elite academia. The recent scandal involved the California Math Framework, a controversial new curriculum plan that has been promoted by Stanford professor Jo Boaler, who, has I learned in a comment thread, wrote a book called Mathematical Mindset that had some really bad stuff in it. As I wrote at the time, it was kind of horrible that this book by a Stanford education professor was making a false claim and backing it up with a bunch of word salad from some rando on the internet. If you can’t even be bothered to read the literature in your own field, what are doing at Stanford in the first place?? Why not just jump over the bay to Berkeley and write uninformed op-eds and hang out on NPR and Fox News? Advocacy is fine, just own that you’re doing it and don’t pretend to be writing about research.

In pointing out Lee’s article, Jonathan Falk writes:

Plenty of scary stuff, but the two lines I found scariest were:

Boaler came to view this victory as a lesson in how to deal with naysayers of all sorts: dismiss and double down.

Boaler said that she had not examined the numbers — but “I do question whether people who are motivated to show something to be inaccurate are the right people to be looking at data.”

I [Falk] geţ a little sensitive about this since I’ve spent 40 years in the belief that people who are motivated to show something to be inaccurate are the perfect people to be looking at the data, but I’m even more disturbed by her asymmetry here: if she’s right, then it must also be true that people who are motivated to show something to be accurate are also the wrong people to be looking at the data. And of course people with no motivations at all will probably never look at the data ever.

We’ve discussed this general issue in many different contexts. There are lots of true believers out there. Not just political activists, also many pure researchers who believe in their ideas, and then you get some people such as discussed above who are true believers both on the research and activism fronts. For these people, I don’t the problem is that they don’t look at the data; rather, they know what they’re looking for and so they find it. It’s the old “researcher degrees of freedom” problem. And it’s natural for researchers with this perspective to think that everyone operates this way, hence they don’t trust outsiders because they think outsiders who might come to different conclusions. I agree with Falk that this is very frustrating, a Gresham process similar to the way that propaganda media are used not just to spread lies and bury truths but also to degrade trust in legitimate news media.

The specific research claims in dispute

Education researcher David Dockterman writes:

I know some of the players. Many educators certainly want to believe, just as many elementary teachers want to believe they don’t have to teach phonics.

Popularity with customers makes it tough for middle ground folks to issue even friendly challenges. They need the eggs. Things get pushed to extremes.

He also points to this post from 2019 by two education researchers, who point to a magazine article coauthored by Boaler and write:

The backbone of their piece includes three points:

1. Science has a new understanding of brain plasticity (the ability of the brain to change in response to experience), and this new understanding shows that the current teaching methods for struggling students are bad. These methods include identifying learning disabilities, providing accommodations, and working to students’ strengths.

2. These new findings imply that “learning disabilities are no longer a barrier to mathematical achievement” because we now understand that the brain can be changed, if we intervene in the right way.

3. The authors have evidence that students who thought they were “not math people” can be high math achievers, given the right environment.

There are a number of problems in this piece.

First, we know of no evidence that conceptions of brain plasticity or (in prior decades) lack of plasticity, had much (if any) influence on educators’ thinking about how to help struggling students. . . . Second, Boaler and Lamar mischaracterize “traditional” approaches to specific learning disability. Yes, most educators advocate for appropriate accommodations, but that does not mean educators don’t try intensive and inventive methods of practice for skills that students find difficult. . . .

Third, Boaler and Lamar advocate for diversity of practice for typically developing students that we think would be unremarkable to most math educators: “making conjectures, problem-solving, communicating, reasoning, drawing, modeling, making connections, and using multiple representations.” . . .

Fourth, we think it’s inaccurate to suggest that “A number of different studies have shown that when students are given the freedom to think in ways that make sense to them, learning disabilities are no longer a barrier to . Yet many teachers have not been trained to teach in this way.” We have no desire to argue for student limitations and absolutely agree with Boaler and Lamar’s call for educators to applaud student achievement, to set high expectations, and to express (realistic) confidence that students can reach them. But it’s inaccurate to suggest that with the “right teaching” learning disabilities in math would greatly diminish or even vanish. . . .

Do some students struggle with math because of bad teaching? We’re sure some do, and we have no idea how frequently this occurs. To suggest, however, that it’s the principal reason students struggle ignores a vast literature on learning disability in mathematics. This formulation sets up teachers to shoulder the blame for “bad teaching” when students struggle.

They conclude:

As to the final point—that Boaler & Lamar have evidence from a mathematics camp showing that, given the right instruction, students who find math difficult can gain 2.7 years of achievement in the course of a summer—we’re excited! We look forward to seeing the peer-reviewed report detailing how it worked.

Indeed. Here’s the relevant paragraph from Boaler and Lamar:

We recently ran a summer mathematics camp for students at Stanford. Eighty-four students attended, and all shared with interviewers that they did not believe they were a “math person.” We worked to change those ideas and teach mathematics in an open way that recognizes and values all the ways of being mathematical: including making conjectures, problem-solving, communicating, reasoning, drawing, modeling, making connections, and using multiple representations. After eighteen lessons, the students improved their achievement on standardized tests by the equivalent of 2.7 years. When district leaders visited the camp and saw students identified as having learning disabilities solve complex problems and share their solutions with the whole class, they became teary. They said it was impossible to know who was in special education and who was not in the classes.

This sort of Ted-worthy anecdote can seem so persuasive! I kinda want to be persuaded too, but I’ve seen too many examples of studies that don’t replicate. There are just so many ways things go wrong.

P.S. Lee has reported on other science problems at Stanford and has afflicted the comfortable, enough that she was unfairly criticized for it.

“Whom to leave behind”

OK, this one is hilarious.

The story starts with a comment from Jordan Anaya, pointing to the story of Michael Eisen, a biologist who, as editor of the academic journal eLife, changed its policy to a public review system. It seems that this policy was controversial, much more so than I would’ve thought. I followed the link Anaya gave to Eisen’s twitter feed, scrolled through, and came across the above item.

There are so many bizarre things about this, it’s hard to know where to start:

– The complicated framing. Instead of just putting them in a lifeboat or something, there’s this complicated story about a spaceship with Earth doomed for destruction.

– It says that these people have been “selected” as passengers. All the worthy people in the world, and they’re picking these guys. “An Accountant with a substance abuse problem”? “A racist police officer”? Who’s doing the selection, exactly? This is the best that humanity has to offer??

– That “Eight (8)” thing. What’s the audience for this: people who don’t know what the word “Eight” means?

– All the partial information, which reminds me of those old-fashioned logic puzzles (“Mr. White lives next door to the teacher, who is not the person who likes to play soccer,” etc.) We hear about the athlete being gay and a vegetarian, but what about the novelist or the international student? Are they gay? What do they eat?

– I love that “militant African American medical student.” I could see some conflict here with the “60-year old Jewish university administrator.” Maybe best not to put both on the same spaceship . . .

– Finally, the funniest part is the dude on twitter who calls this “demonic.” Demonic’s a bad thing, right?

Anyway, I was curious where this all came from so I googled *Whom to Leave Behind* and found lots of fun things. A series of links led to this 2018 news article from News5 Cleveland:

In an assignment given out at Roberts Middle School in Cuyahoga Falls, students had to choose who they felt were “most deserving” to be saved from a doomed Earth from a list based on race, religion, sexual orientation and other qualifications. . . .

In a Facebook post, Councilman Adam Miller said he spoke with the teacher who gave the assignment. He said the teacher intended to promote diversity. Miller told News 5 the teacher apologized for the assignment that has caused such controversy.

The Facebook link takes us here:

Hey—they’re taking the wife but leaving the accountant behind. How horrible!

The comments to the post suggest this activity has been around for awhile:

And one of the commenters points to this variant:

I’m not sure exactly why, but I find this one a lot less disturbing than the version with the militant student, the racist cop, and the Jew.

There are a bunch of online links to that 2018 story. Even though the general lifeboat problem is not new, it seems like it only hit the news that one time.

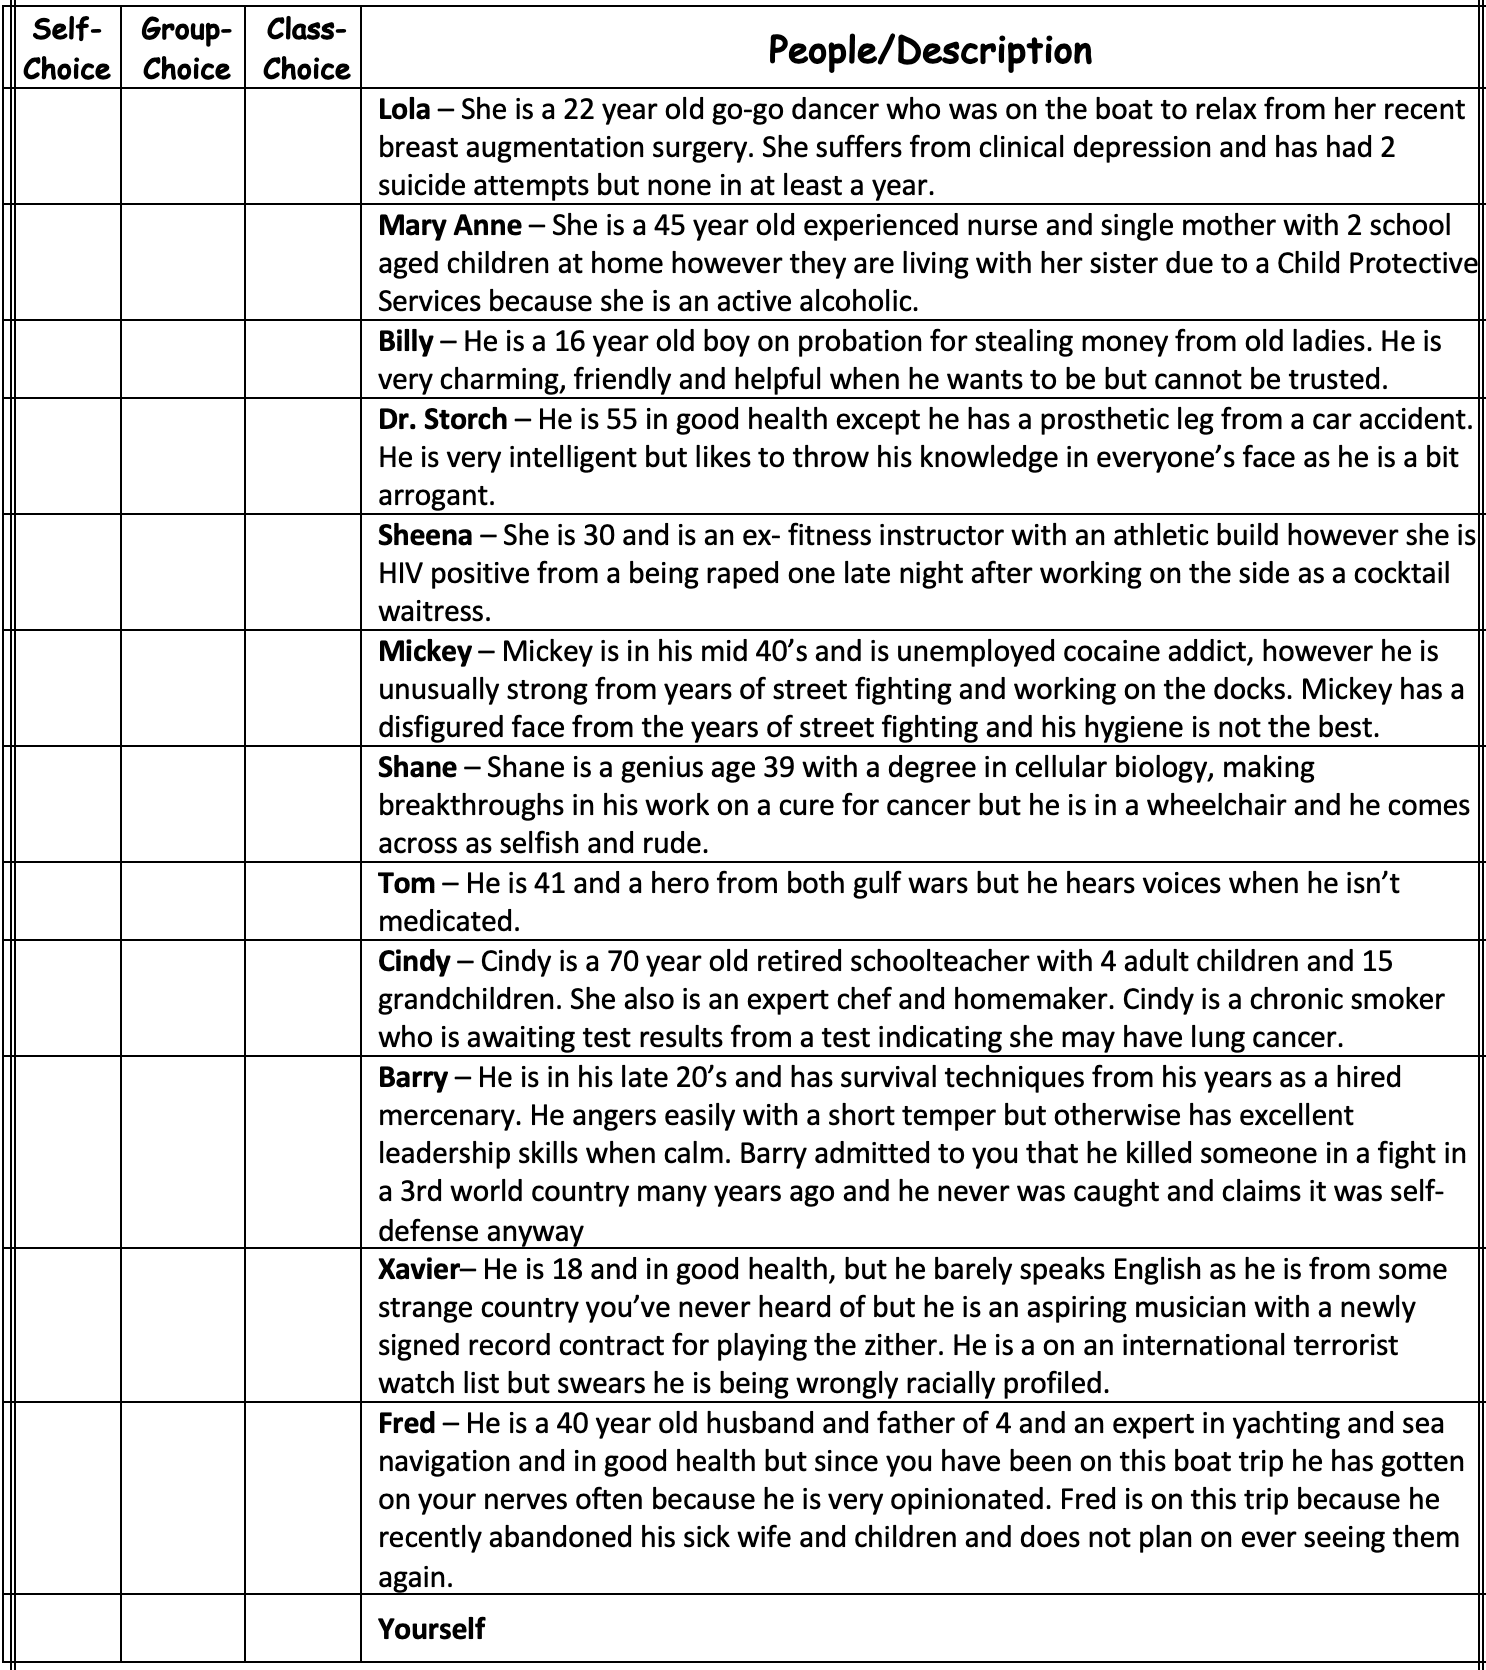
But . . . further googling turns up lots of variants. Particularly charming was this version with ridiculously elaborate descriptions:

I love how they give each person a complex story. For example, sure, Shane is curing cancer, “but he is in a wheelchair.” I assume they wouldn’t have to take the chair onto the boat, though!

Also they illustrate the story with this quote:

“It’s not hard to make decisions when you know what your values are” – Roy Disney

This is weird, given that the whole point of the exercise is that it is hard to make decisions.

Anyway, the original lifeboat activity seems innocuous enough, a reasonable icebreaker for class discussion. But, yeah, adding all the ethnic stuff just seems like you’re asking for trouble.

It’s more fun than the trolley problem, though, I’ll give it that.

NYT does some rewriting without attribution. I guess this is standard in journalism but it seems unethical to me.

Palko points to this post by journalist Lindsay Jones, who writes:

It’s flattering to see @nytimes rewrite my [Jones’s] feature on two Canadian men switched at birth. You can read the original, exclusively reported @globeandmail story I took months to research and write as a former freelancer here: https://www.theglobeandmail.com/canada/article-switched-at-birth-manitoba/

The original article, published 10 Feb 2023 in the Toronto newspaper The Globe and Mail, is called “A hospital’s mistake left two men estranged from their heritages. Now they fight for answers,” subtitled, “In 1955, a Manitoba hospital sent Richard Beauvais and Eddy Ambrose home with the wrong families. After DNA tests revealed the mix-up, both want an explanation and compensation.” It begins:

One winter evening in 2020, Richard Beauvais and his wife pored over the online results of a genealogical DNA kit.

“They screwed up,” Mr. Beauvais surmised, sitting at the kitchen island in his ranch style home near the coastal community of Sechelt, B.C.

According to the test, he was Ukrainian, Polish and Jewish. Mr. Beauvais was stupefied. Mr. Beauvais, whose mother was Cree, grew up in a Métis settlement on the shores of Lake Manitoba and was taken into foster care at age eight or nine. The kit was a gift from his eldest daughter to help Mr. Beauvais learn more about his roots, including his French father, who died when he was 3. But here in front of him was a list of names and nationalities that, he thought, couldn’t be his. . . .

The followup appeared in the New York Times on 2 Aug 2023 and is called “Switched at Birth, Two Canadians Discover Their Roots at 67,” with subtitle “Two Canadian men who were switched at birth to families of different ethnicities are now questioning who they really are and learning how racial heritage shapes identities.” It begins:

Richard Beauvais’s identity began unraveling two years ago, after one of his daughters became interested in his ancestry. She wanted to learn more about his Indigenous roots — she was even considering getting an Indigenous tattoo — and urged him to take an at-home DNA test. Mr. Beauvais, then 65, had spent a lifetime describing himself as “half French, half Indian,” or Métis, and he had grown up with his grandparents in a log house in a Métis settlement.

So when the test showed no Indigenous or French background but a mix of Ukrainian, Ashkenazi Jewish and Polish ancestry, he dismissed it as a mistake and went back to his life as a commercial fisherman and businessman in British Columbia.

It’s amusing to see where the two articles differ. The Globe and Mail is a Canadian newspaper so they don’t need to keep reminding us in their headlines that the men are “Canadian.” They can jump right to “Manitoba” and “B.C.,” and they can just use the word “Métis” without defining him. For the Times, on the other hand, the “Jewish” part of the roots wasn’t enough—they needed to clarify for their readers that it was “Ashkenazi Jewish.”

What happened?

Did the Times article rip off the Globe and Mail article? We may never know. There are lots of similarities, but ultimately the two articles are telling the same story, so it makes sense the articles will be similar too. For example, the Times article mentions a tattoo that the daughter was considering, and the original Globe and Mail article has a photo of the tattoo she finally chose.

So what happened? One possibility is that the NYT reporter, who covers Canada and is based in Montreal, read the Globe and Mail story when it came out and decided to follow it up further. If I were a news reporter covering Canada, I’d probably read many newspapers each day from beginning to end—including the Globe and Mail. Another possibility is that the NYT reporter heard about the story from someone who’d read the Globe and Mail story, he decided to follow up . . . in either case, it seems plausible that it would take a few months for it to get written and published.

It’s extremely hard to believe that the NYT reporter was unaware of the Globe and Mail article. If you’re writing a news article, you’ll google its subjects to make sure there’s nothing major that you’re missing. Here’s what comes up—I restricted the search to end on 31 July 2023 to avoid anything that came after the Times article appeared:

The first link above is the Globe and Mail article in question. The second link comes from something called Global News. They don’t link to or mention the Globe and Mail article either, but I guess they, like the Times a few months later, did some reporting of their own because they include a quote that was not in the original article.

Given that no Google links to the two names appeared before 10 Feb, I’m guessing that the Globe and Mail article from that date was the first time the story appeared. I wonder how Lindsay Jones, the author of that original article, came up with the story? At the end of the article it says:

Last year, reporter Lindsay Jones unravelled the mystery of how two baby girls got switched at a Newfoundland hospital in 1969.

And, at the end of that article, it says:

Freelance journalist Lindsay Jones spoke with The Decibel about unravelling the mystery of how Arlene Lush and Caroline Weir-Greene were switched at birth.

Unfortunately, The Decibel only seems to be audio with no transcript, so I’ll leave it to any of you to listen through for the whole story.

Standard practice

I think it’s standard practice in journalism to avoid referring or linking to whoever reported on the story before you. I agree with Jones that this is bad practice. Even beyond the issue of giving credit to the reporter who broke the story and the newspaper that gave space to publish it, it can be helpful to the reader to know the source.

This is not as bad as the story of the math professor who wrote a general-interest book about chess in which he took stories from other sources without attribution and introduced errors in the process. As I wrote at the time, that’s soooo frustrating, when you copy without clear attribution but you bungle it. I think that the act of hiding the sourcing makes it that much tougher to find the problem. Fewer eyes, less transparency.

Nor is at as bad as when a statistics professor copied without attribution from Wikipedia, again introducing his own errors. Yes, some faculty do add value—it’s just negative value.

The articles from Global News and the New York Times seem better than those cases, in that the authors did their own reporting. Still, it does a disservice to readers, as well as the reporter of the original story, to hide the source. Even if it’s standard practice, I still think it’s tacky.

(from 2017 but still relevant): What Has the Internet Done to Media?

Aleks Jakulin writes:

The Internet emerged by connecting communities of researchers, but as Internet grew, antisocial behaviors were not adequately discouraged.

When I [Aleks] coauthored several internet standards (PNG, JPEG, MNG), I was guided by the vision of connecting humanity. . . .

The Internet was originally designed to connect a few academic institutions, namely universities and research labs. Academia is a community of academics, which has always been based on the openness of information. Perhaps the most important to the history of the Internet is the hacker community composed of computer scientists, administrators, and programmers, most of whom are not affiliated with academia directly but are employed by companies and institutions. Whenever there is a community, its members are much more likely to volunteer time and resources to it. It was these communities that created websites, wrote the software, and started providing internet services.

“Whenever there is a community, its members are much more likely to volunteer time and resources to it” . . . so true!

As I wrote a few years ago, Create your own community (if you need to).

But it’s not just about community; you also have to pay the bills.

Aleks continues:

The skills of the hacker community are highly sought after and compensated well, and hackers can afford to dedicate their spare time to the community. Society is funding universities and institutes who employ scholars. Within the academic community, the compensation is through citation, while plagiarism or falsification can destroy someone’s career. Institutions and communities have enforced these rules both formally and informally through members’ desire to maintain and grow their standing within the community.

Lots to chew on here. First, yeah, I have skills that allow me to be compensated well, and I can afford to dedicate my spare time to the community. This is not new: back in the early 1990s I wrote Bayesian Data Analysis in what was essentially my spare time, indeed my department chair advised me not to do it at all—master of short-term thinking that he was. As Aleks points out, was a time when a large proportion of internet users had this external compensation.

The other interesting thing about the above quote is that academics and tech workers have traditionally had an incentive to tell the truth, at least on things that can be checked. Repeatedly getting things wrong would be bad for your reputation. Or, to put it another way, you could be a successful academic and repeatedly get things wrong, but then you’d be crossing the John Yoo line and becoming a partisan hack. (Just to be clear, I’m not saying that being partisan makes you a hack. There are lots of scholars who express strong partisan views but with intellectual integrity. The “hack” part comes from getting stuff wrong, trying to pass yourself off as an expert on topics you know nothing about, ultimately being willing to say just about anything if you think it will make the people on your side happy.)

Aleks continues:

The values of academic community can be sustained within universities, but are not adequate outside of it. When businesses and general public joined the internet, many of the internet technologies and services were overwhelmed with the newcomers who didn’t share their values and were not members of the community. . . . False information is distracting people with untrue or irrelevant conspiracy theories, ineffective medical treatments, while facilitating terrorist organization recruiting and propaganda.

I’ve not looked at data on all these things, but, yeah, from what I’ve read, all that does seem to be happening.

Aleks then moves on to internet media:

It was the volunteers, webmasters, who created the first websites. Websites made information easily accessible. The website was property and a brand, vouching for the reputation of the content and data there. Users bookmarked those websites they liked so that they could revisit them later. . . .

In those days, I kept current about the developments in the field by following newsgroups and regularly visiting key websites that curated the information on a particular topic. Google entered the picture by downloading all of Internet and indexing it. . . . the perceived credit for finding information went to Google and no longer to the creators of the websites.

He continues:

After a few years of maintaining my website, I was no longer receiving much appreciation for this work, so I have given up maintaining the pages on my website and curating links. This must have happened around 2005. An increasing number of Wikipedia editors are giving up their unpaid efforts to maintain quality in the fight with vandalism or content spam. . . . On the other hand, marketers continue to have an incentive to put information online that would lead to sales. As a result of depriving contributors to the open web with brand and credit, search results on Google tend to be of worse quality.

And then:

When Internet search was gradually taking over from websites, there was one area where a writer’s personal property and personal brand were still protected: blogging. . . . The community connected through the comments on blog posts. The bloggers were known and personally subscribed to.

That’s where I came in!

Aleks continues:

Alas, whenever there’s an unprotected resource online, some startup will move in and harvest it. Social media tools simplified link sharing. Thus, an “influencer” could easily post a link to an article written by someone else within their own social media feed. The conversation was removed from the blog post and instead developed in the influencer’s feed. As a result, carefully written articles have become a mere resource for influencers. As a result, the number of new blogs has been falling.
Social media companies like Twitter and Facebook reduced barriers to entry by making so easy to refer to others’ content . . .

I hadn’t thought about this, but, yeah, good point.

As a producer of “content”—for example, what I’m typing right now—I don’t really care if people come to this blog from Google, Facebook, Twitter, an RSS feed, or a link on their browser. (There have been cases where someone’s stripped the material from here and put it on their own site without acknowledging the source, but that’s happened only rarely.) Any of those legitimate ways of reaching this content is fine with me: my goal is just to get it out there, to inform people and to influence discussion. I already have a well-paying job, so I don’t need to make money off the blogging. If it did make money, that would be fine—I could use it to support a postdoc—but I don’t really have a clear sense of how that would happen, so I haven’t ever looked into it seriously.

The thing I hadn’t thought about was that, even if to me it doesn’t matter where our reader are coming, this does matter to the larger community. Back in the day, if someone wanted to link or react to something on a blog, they’d do it in their own blog or in a comment section. Now they can do it from Facebook or Twitter. The link itself is no problem, but there is a problem in that there’s less of an expectation of providing new content along with the link. Also, Facebook and Twitter are their own communities, which have their strengths but which are different than those of blogs. In particular, blogging facilitates a form of writing where you fill in all the details of your argument, where you can go on tangents if you’d like, and where you link to all relevant sources. Twitter has the advantage of immediacy, but often it seems more like community without the content, where people can go on and say what they love or hate but without the space for giving their reasons.

The connection between junk science and sloppy data handling: Why do they go together?

Nick Brown pointed me to a new paper, “The Impact of Incidental Environmental Factors on Vote Choice: Wind Speed is Related to More Prevention-Focused Voting,” to which his reaction was, “It makes himmicanes look plausible.” Indeed, one of the authors of this article had come up earlier on this blog as a coauthor of paper with fatally-flawed statistical analysis. So, between the general theme of this new article (“How might irrelevant events infiltrate voting decisions?”), the specific claim that wind speed has large effects, and the track record of one of the authors, I came into this in a skeptical frame of mind.

That’s fine. Scientific papers are for everyone, not just the true believers. Skeptics are part of the audience too.

Anyway, I took a look at the article and replied to Nick:

The paper is a good “exercise for the reader” sort of thing to find how they managed to get all those pleasantly low p-values. It’s not as blatantly obvious as, say, the work of Daryl Bem. The funny thing is, back in 2011, lots of people thought Bem’s statistical analysis was state-of-the-art. It’s only in retrospect that his p-hacking looks about as crude as the fake photographs that fooled Arthur Conan Doyle. Figure 2 of this new paper looks so impressive! I don’t really feel like putting in the effort to figuring out exactly how the trick was done in this case . . . Do you have any ideas?

Nick responded:

There are some hilarious errors in the paper. For example:
– On p. 7 of the PDF, they claim that “For Brexit, the “No” option advanced by the Stronger In campaign was seen as clearly prevention-oriented (Mean (M) = 4.5, Standard Error (SE) = 0.17, t(101) = 6.05, p < 0.001) whereas the “Yes” option put forward by the Vote Leave campaign was viewed as promotion-focused (M = 3.05, SE = 0.16, t(101) = 2.87, p = 0.003).": But the question was not "Do you want Brexit, Yes/No". It was "Should the UK Remain in the EU or Leave the EU". Hence why the pro-Brexit campaign was called "Vote Leave", geddit? Both sides agreed on before the referendum that this was fairer and clearer than Yes/No. Is "Remain" more prevention-focused than "Leave"? - On p. 12 of the PDF, they say "In the case of the Brexit vote, the Conservative Party advanced the campaign for the UK to leave the EU." This is again completely false. The Conservative government, including Prime Minister David Cameron, backed Remain. It's true that a number of Conservative politicians backed Leave, and after the referendum lots of Conservatives who had backed Remain pretended that they either really meant Leave or were now fine with it, but if you put that statement, "In the case of the Brexit vote, the Conservative Party advanced the campaign for the UK to leave the EU" in front of 100 UK political scientists, not one will agree with it. If the authors are able to get this sort of thing wrong then I certainly don't think any of their other analyses can be relied upon without extensive external verification. If you run the attached code on the data (mutatis mutandis for the directories in which the files live) you will get Figure 2 of the Mo et al. paper. Have a look at the data (the CSV file is an export of the DTA file, if you don't use Stata) and you will see that they collected a ton of other variables. To be fair they mention these in the paper ('Additionally, we collected data on other Election Day weather indicators (i.e., cloud cover, dew point, precipitation, pressure, and temperature), as well as historical wind speeds per council area.5 The inclusion of other Election Day weather indicators increases our confidence that we are detecting an association between wind speed and election outcomes, and not the effect of other weather indicators that may be correlated with wind speed.") My guess is that they went fishing and found that wind speed, as opposed to the other weather indicators that they mentioned, gave them a good story. Looking only at the Swiss data, I note that they also collected "Income", "Unemployment", "Age", "Race" (actually the percentage of foreign-born people; I doubt if Switzerland collects "Race" data; Supplement, Table S3, page 42), "Education", and "Rural", and threw those into their model as well. They also collected latitude and longitude (of the centroid?) for each canton, although those didn't make it into the analyses. Also they include "Turnout", but for any given Swiss referendum it seems that they only had the national turnout because this number is always the same for every "State" (canton) for any given "Election" (referendum). And the income data looks sketchy (people in Schwyz canton do not make 2.5 times what people in Zürich canton do). I think this whole process shows a degree of naivety about what "kitchen-sink" regression analyses (and more sophisticated versions thereof) can and can't do, especially with noisy measures (such as "Precipitation" coded as 0/1). Voter turnout is positively correlated with precipitation but negatively with cloud cover, whatever that means. Another glaring omission is any sort of weighting by population. The most populous canton in Switzerland has a population almost 100 times the least populous, yet every canton counts equally. There is no "population" variable in the dataset, although this would have been very easy to obtain. I guess this means they avoid the ecological fallacy, up to the point where they talk about individual voting behaviour (i.e., pretty much everywhere in the article).

Nick then came back with more:

I found another problem, and it’s huge:

For “Election 50”, the Humidity and Dew Point data are completely borked (“relative humidity” values around 1000 instead of 0.6 etc; dew point 0.4–0.6 instead of a Fahrenheit temperature slightly below the measured temperature in the 50–60 range). When I remove that referendum from the results, I get the attached version of Figure 2. I can’t run their Stata models, but by my interpretation of the model coefficients from the R model that went into making Figure 2, the value for the windspeed * condition interaction goes from 0.545 (SE=0.120, p=0.000006) to 0.266 (SE=0.114, p=0.02).

So it seems to me that a very big part of the effect, for the Swiss results anyway, is being driven by this data error in the covariates.

And then he posted a blog with further details, along with a link to some other criticisms from Erik Gahner Larsen.

The big question

Why do junk science and sloppy data handling so often seem together? We’ve seen this a lot, for example the ovulation-and-voting and ovulation-and-clothing papers that used the wrong dates for peak fertility, the Excel error paper in economics, the gremlins paper in environmental economics, the analysis of air pollution in China, the collected work of Brian Wansink, . . . .

What’s going on? My hypothesis is as follows. There are lots of dead ends in science, including some bad ideas and some good ideas that just don’t work out. What makes something junk science is not just that it’s studying an effect that’s too small to be detected with noisy data; it’s that the studies appear to succeed. It’s the misleading apparent success that’s turns a scientific dead end into junk science.

As we’ve been aware since the classic Simmons et al. paper from 2011, researchers can and do use researcher degrees of freedom to obtain apparent strong effects from data that could well be pure noise. This effort can be done on purpose (“p-hacking”) or without the researchers realizing it (“forking paths”), or through some mixture of the two.

The point is that, in this sort of junk science, it’s possible to get very impressive-looking results (such as Figure 2 in the above-linked article) from just about any data at all! What that means is that data quality doesn’t really matter.

If you’re studying a real effect, then you want to be really careful with your data: any noise you introduce, whether in measurement or through coding error, can be expected to attenuate your effect, making it harder to discover. When you’re doing real science you have a strong motivation to take accurate measurements and keep your data clean. Errors can still creep in, sometimes destroying a study, so I’m not saying it can’t happen. I’m just saying that the motivation is to get your data right.

In contrast, if you’re doing junk science, the data are not so relevant. You’ll get strong results one way or another. Indeed, there’s an advantage to not looking too closely at your data at first; that way if you don’t find the result you want, you can go through and clean things up until you reach success. I’m not saying the authors of the above-linked paper did any of that sort of thing on purpose; rather, what I’m saying is that they have no particular incentive to check their data, so from that standpoint maybe we shouldn’t be so surprised to see gross errors.

Unifying Design-Based and Model-Based Sampling Inference (my talk this Wednesday morning at the Joint Statistical Meetings in Toronto)

Wed 9 Aug 10:30am:

Unifying Design-Based and Model-Based Sampling Inference

A well-known rule in practical survey research is to include weights when estimating a population average but not to use weights when fitting a regression model—as long as the regression includes as predictors all the information that went into the sampling weights. But it is not clear how to apply this advice when fitting regressions that include only some of the weighting information, nor does it tell us what to do when analyzing already-collected surveys where the weighting procedure has not been clearly explained or where the weights depend in part on information that is not available in the data. It is also not clear how one is supposed to account for clustering in such analyses. We propose a quasi-Bayesian approach using a joint regression of the outcome and the sampling weight, followed by poststratifcation on the two variables, thus using design information within a model-based context to obtain inferences for small-area estimates, regressions, and other population quantities of interest.

No slides, but I whipped up a paper on the topic which you can read if you want to get a sense of the idea.

“They got a result they liked, and didn’t want to think about the data.” (A fish story related to Cannery Row)

John “Jaws” Williams writes:

Here is something about a century-old study that you may find interesting, and could file under “everything old is new again.”

In 1919, the California Division of Fish and Game began studying the developing sardine fishery in Monterey. Ten years later, W. L. Scofield published an amazingly through description of the fishery, the abstract of which begins as follows:

The object of this bulletin is to put on record a description of the Monterey sardine fishery which can be used as a basis for judging future changes in the conduct of this industry. Detailed knowledge of changes is essential to an understanding of the significance of total catch figures, or of records of catch per boat or per seine haul. It is particularly necessary when applying any form of catch analysis to a fishery as a means of illustrating the presence or absence of depletion or of natural fluctuations in supply.

As detailed in this and subsequent reports, the catch was initially limited by the market and the capacity of the fishing fleet, both of which grew rapidly for several decades and provided the background for John Steinbeck’s “Cannery Row.” Later, sardine population famously collapsed, and never recovered.

Sure enough, just as Scofield feared, scientists who did not understand the data subsequently misused it as reflecting the sardine population, as I pointed out in this letter (which got the usual kind of response). They got a result they liked, and didn’t want to think about the data.

The Division of Fisheries was not the only agency to publish detailed descriptive reports. The USGS and other agencies did as well, but generally they have gone out of style; they take a lot of time and field work, are expensive to publish, and don’t get the authors much credit.

This comes to mind because I am working on a paper about a debris flood on a stream in one of the University of California’s natural reserves, and the length limits for the relevant print journals don’t allow for a reasonable description of the event and a discussion of what it means. However, now I can write a separate and more complete description, and have it go as on-line supplementary material. There is some progress.

Studying average associations between income and survey responses on happiness: Be careful about deterministic and causal interpretations that are not supported by these data.

Jonathan Falk writes:

This is an interesting story of heterogeneity of response, and an interesting story of “adversarial collaboration,” and an interesting PNAS piece. I need to read it again later this weekend, though, to see if the stats make sense.

The article in question, by Matthew Killingsworth, Daniel Kahneman, and Barbara Mellers, is called “Income and emotional well-being: A conflict resolved,” and it begins:

Do larger incomes make people happier? Two authors of the present paper have published contradictory answers. Using dichotomous questions about the preceding day, Kahneman and Deaton reported a flattening pattern: happiness increased steadily with log(income) up to a threshold and then plateaued. Using experience sampling with a continuous scale, Killingsworth reported a linear-log pattern in which average happiness rose consistently with log(income). We engaged in an adversarial collaboration to search for a coherent interpretation of both studies. A reanalysis of Killingsworth’s experienced sampling data confirmed the flattening pattern only for the least happy people. Happiness increases steadily with log(income) among happier people, and even accelerates in the happiest group. Complementary nonlinearities contribute to the overall linear-log relationship. . . .

I agree with Falk that the collaboration and evaluation of past published work is great, and I’m happy with the discussion, which is focused so strongly on data and measurement and how they map to conclusions. I don’t know why they call it “adversarial collaboration,” as I don’t see anything adversarial here. That’s a good thing! I’m glad they’re cooperating. Maybe they could just call it “collaboration from multiple perspectives” or something like that.

On the substance, I think the article has two main problems, both of which are exhibited by its very first line:

Do larger incomes make people happier?

Two problems here:

1. Determinism. The question, “Do larger incomes make people happier?”, does not admit variation. Larger incomes are gonna make some people happier in some settings.

2. Causal attribution. If I’m understanding correctly, the data being analyzed are cross-sectional; to put it colloquially, they’re looking at correlation, not causation.

3. Framing in terms of a null hypothesis. Neither of the two articles that motivated this work suggested a zero pattern.

Putting these together, the question, “Do larger incomes make people happier?”, would be more accurately written as, “How much happier are people with high incomes, compared to people with moderate incomes?”

Picky, Picky

You might say that I’m just being picky here; when they ask, “Do larger incomes make people happier?”, everybody knows they’re really talking about averages (not about “people” in general), that they’re talking about association (not about anything “making people happier”), and that they’re doing measurement, not answering a yes-or-no question.

And, sure, I’m a statistician. Being picky is my business. Guilty as charged.

But . . . I think my points 1, 2, 3 are relevant to the underlying questions of interest, and dismissing them as being picky would be a mistake.

Here’s why I say this.

First, the determinism and the null-hypothesis framing leads to a claim about, “Can money buy happiness?” We already know that money can buy some happiness, some of the time. The question, “Are richer people happier, on average?”, that’s not the same, and I think it’s a mistake to confuse one with the other.

Second, the sloppiness about causality ends up avoiding some important issues. Start with the question, “Do larger incomes make people happier?” There are many ways to have larger incomes, and these can have different effects.

One way to see this is to flip the question around and ask, “Do smaller incomes make people unhappier?” The funny thing is, based Kahneman’s earlier work on loss aversion, he’d probably say an emphatic Yes to that question. But we can also see that there are different ways to have a smaller income. You might choose to retire—or be forced to do so. You might get fired. Or you might take time off from work to take care of young children. Or maybe you’re just getting pulled by the tides of the national economy. All sorts of possibilities.

A common thread here is that it’s not necessarily the income causing the mood change; it’s that the change in income is happening along with other major events that can affect your mood. Indeed, it’s hard to imagine a big change in income that’s not associated with other big changes in your life.

Again, nothing wrong with looking at average associations of income and survey responses about happiness and life satisfaction. These average associations are interesting in their own right; no need to try to give them causal interpretations that they cannot bear.

Again, I like a lot of the above-linked paper. Within the context of the question, “How much happier are people with high incomes, compared to people with moderate incomes?”, they’re doing a clean, careful analysis, kinda like what my colleagues and I tried to do when reconciling different evaluations of the Millennium Villages Project, or as I tried to do when tracking down an iffy claim in political science. Starting with a discrepancy, getting into the details and figuring out what was going on, then stepping back and considering the larger implications: that’s what it’s all about.

It was an open secret for years and years that they were frauds, but nobody seemed to care.

I love this story so much I’m gonna tell it again:

I remember the Watergate thing happening when I was a kid, and I asked my dad, “So, when did you realize that Nixon was a crook?” My dad replied, “1946.” He wasn’t kidding. Nixon being an opportunistic liar was all out there from the very beginning of his career, and indeed this was much discussed in the press. Eventually just about everybody acknowledged it, but it took awhile.

When I posted this before, I listed a few examples where some people were able to stay afloat for years and years after their lying or fraud or misrepresentation or impossible promises were apparent:

– Theranos: the famed blood-testing company faked a test in 2006, causing one of its chief executives to leave, but it wasn’t until 2018 that the whole thing went down. They stayed afloat for over a decade after the fraud.

– Pizzagate guy from Cornell: people had noticed major problems in his work, but he managed to dodge all criticism for several years before being caught.

– Some obscure Canadian biologist: The problems were first flagged in 2010, this dude continued doing suspicious things for over a decade, and it finally came out in 2022.

There’s also that Los Angeles tunnel that didn’t make sense back in 2018 and still makes no sense.

And here’s another one:

Effective Altruist Leaders Were Repeatedly Warned About Sam Bankman-Fried Years Before FTX Collapsed

Leaders of the Effective Altruism movement were repeatedly warned beginning in 2018 that Sam Bankman-Fried was unethical, duplicitous, and negligent . . . They apparently dismissed those warnings, sources say, before taking tens of millions of dollars from Bankman-Fried’s charitable fund for effective altruist causes. . . . When Alameda and Bankman-Fried’s cryptocurrency exchange FTX imploded in late 2022, these same effective altruist (EA) leaders professed outrage and ignorance.

“Think long-term. Act now.” What could possibly go wrong??

I don’t have any deep theories about this one. It’s just interesting to me as another example where the problems were clear to people in the know, but because of some combination of personal/political interests and restricted information flow, nothing happened for years.

What’s the story with news media insiders getting all excited about UFOs?

Philip Greengard writes:

This tweet by Nate Silver in which he says that the UFOs that made news recently are “almost definitely not aliens” reminded me of some discussions on your blog including this. I thought you had another blog post about motivations of pundits around uncertainty but I can’t find it. I’m not claiming this is any sort of “gotcha,” but I thought it was somewhat interesting/revealing that Nate felt the need to include “almost” in his prediction.

Yeah, that’s funny. Some further background is that a couple years ago a bunch of elite journalists were floating the idea that UFOs might actually be aliens, or that we should be taking UFOs seriously, or something like that. I had an exchange back in 2020 with a well-respected journalist who wrote, “The Navy is releasing videos of pilots watching something in the air that is blowing their minds, It’s worth exploring what it is! Likely it’s not aliens, but I’d like to know what it is.”

So I think Nate’s comment is just a reflection of the elite media bubble in which he lives. A couple other UFO-curious people who are well connected in the news media are Ezra Klein and Tyler Cowen.

Another way to put it is: Common sense and logic say that UFOs are not space aliens. On the other hand, it’s gotta be that millions of Americans believe it . . . aaaah, here it is, from Gallup:

Four in 10 Americans now think some UFOs that people have spotted have been alien spacecraft visiting Earth from other planets or galaxies. This is up from a third saying so two years ago. Half, however, believe all such sightings can be explained by human activity or natural phenomena, while an additional 9% are unsure.

And, as I never tire of reminding you, polls find that 30% of Americans believe in ghosts. OK, polls aren’t perfect, but no matter how you slice it, lots of people believe in these things.

From that perspective, yeah, if 40% of Americans believe something, it’s no surprise that some fraction of journalists believe it too. Maybe not 40%, but even if it’s only 20%, or 10%, that’s still a bunch. Enough so that some might be personal friends of Nate, so he’ll think, “Sure, that space aliens thing seems pretty implausible, but my friends X and Y are very reasonable people, and they believe it, so maybe there’s something there . . .”

It all sounds funny to Philip and me, but that’s just because we’re not linked into a big network of friends/colleagues who opinionate about such things. Nate Silver sees that Ezra Klein and Tyler Cowen believe that UFO’s might be space aliens, so . . . sure, why not at least hedge your bets on it, right? So I think there’s some contagion here, not exactly a consensus within the pundit class but within the range of consensus opinion.

P.S. More here from Palko, with a focus on the NYT being conned. I think part of this story, as noted above, is what might be called the lack of statistical independence of the news media: if Klein, Cowen, and Silver believe this, this is not three independent data points. The other thing is that there are all sorts of dangerous conspiracy theories out there now. Maybe some people like to entertain the theory that UFO’s are space aliens because this theory is so innocuous.

Just to summarize: Palko blames the New York Times for the mainstreaming of recent UFO hype. I guess this must be part of the story (UFO enthusiast gets the UFO assignment and runs with it), but I still see this is as more of a general elite media bubble. Neither Nate Silver nor Tyler Cowen work for the Times—indeed, either of them might well like to see the Times being taken down a peg—and I see their UFO-friendliness as an effect of being trapped in a media consensus.

Here’s another way to look at it. A few years ago, Nate wrote, “Elites can have whatever tastes they want and there’s no reason they ought to conform to mainstream culture. But I do think a lot of elites would fail a pop quiz on how the median American thinks and behaves, and that probably makes them a less effective advocate for their views.” There is of course no such thing as “the median American,” but I get what he’s saying. Lots of Americans believe in UFO’s, ghosts, etc. According to a Pew Research survey from 2021, 11% of Americans say that UFOs reported by people in the military are “definitely” evidence of intelligent life outside Earth (with 40% saying “probably,” 36% saying “probably not,” and 11% saying “definitely not”). Younger and less educated people are slightly more likely to answer “definitely” or “probably” to that question, but the variation by group is small; it’s close to 50% for every slice of the population. The “median American,” then, is torn on the issue, so Nate and the New York Times are in tune with America on this one. Next stop, ghosts (more here)!

P.P.S. Non-elite journalists are doing it too! But I guess they’re just leaping on the bandwagon. If it’s good enough for the New York Times, Nate Silver, Ezra Klein, and Tyler Cowen, it’s good enough for the smaller fish in the media pond.

P.P.P.S. Still more from Palko. It remains interesting that this hasn’t seemed to have become political yet. But maybe it will drift to the right, in the same way as many other conspiracy theories, in which case our news media overlords might start telling us that, by laughing at the idea of UFOs being space aliens, we’re just out-of-touch elitists. Nate and the NYT are ahead of the game by taking these ideas seriously already. They’re in touch with the common people in a way that Greengard, Palko, I, and the other 50% of Americans who are don’t believe that UFOs are space aliens will never be.

P.P.P.P.S. Still more here from Palko. It’s just sad to see all these media insiders fall for it. Again, though, millions of otherwise-savvy Americans believe in ghosts, too. I think the key is not that these otherwise-savvy media insiders are so receptive to the UFOs-as-space-aliens theory, as that something has changed and it’s acceptable for them to share their views. Probably lots of media insiders are receptive to ghosts, astrology, and other classic bits of pseudoscience and fraud (not to mention more serious things such as racism and anti-vaccine messages), but they won’t talk much about it because these ideas are generally considered ridiculous or taboo. But some impressive efforts by a handful of conspiracy-minded space-alien theorists have pushed this UFO thing into the mainstream.

Problem with the University of Wisconsin’s Area Deprivation Index. And, no, face validity is not “the weakest of all possible arguments.”

A correspondent writes:

I thought you might care to comment on a rebuttal in today’s HealthAffairs. I find it a poor non-defense that relies on “1000s of studies used our measure and found it valid”, as well as attacks on the critics of their work.

The issue began when the Center of Medicare & Medicaid Services (CMS) decided to explore a health equity payment model called ACO-REACH. CMS chose a revenue neutral scheme to remove some dollars from payments to providers serving the most-advantaged people and re-allocate those dollars to the most disadvantaged. Of course, CMS needs to choose a measure of poverty that is 100% available and easy to compute. These requirements limit the measure to a poverty index available from Census data.

CMS chose to use a common poverty index, University of Wisconsin’s Area Deprivation Index (ADI). Things got spicy earlier this year when some other researchers noticed that no areas in the Bronx or south-eastern DC are in the lowest deciles of the ADI measure. After digging into the ADI methods a bit deeper, it seems the issue is that the ADI does not scale the housing dollars appropriately before using that component in a principal components analysis to create the poverty index.

One thing I find perplexing about the rebuttal from UWisc is that it completely ignores the existence of every other validated poverty measure, and specifically the CDC’s Social Vulnerability Index. Their rebuttal pretends that there is no alternative solution available, and therefore the ADI measure must be used as is. Lastly, while ADI is publicly available, it is available under a non-commercial license so it’s a bit misleading for the authors to not disclose that they too have a financial interest in pushing the ADI measure while accusing their critics of financial incentives for their criticism.

The opinions expressed here are my own and do not reflect those of my employer or anyone else. I would prefer to remain anonymous if you decide to report this to your blog, as I wish to not tie these personal views to my employer.

Interesting. I’d never heard of any of this.

Here’s the background:

Living in a disadvantaged neighborhood has been linked to a number of healthcare outcomes, including higher rates of diabetes and cardiovascular disease, increased utilization of health services, and earlier death1-5. Health interventions and policies that don’t account for neighborhood disadvantage may be ineffective. . . .

The Area Deprivation Index (ADI) . . . allows for rankings of neighborhoods by socioeconomic disadvantage in a region of interest (e.g., at the state or national level). It includes factors for the theoretical domains of income, education, employment, and housing quality. It can be used to inform health delivery and policy, especially for the most disadvantaged neighborhood groups. “Neighborhood” is defined as a Census block group. . . .

The rebuttal

Clicking on the above links, I agree with my correspondent that there’s something weird about the rebuttal article, starting with its title, “The Area Deprivation Index Is The Most Scientifically Validated Social Exposome Tool Available For Policies Advancing Health Equity,” which elicits memories of Cold-War-era Pravda, or perhaps an Onion article parodying the idea of someone protesting too much.

The article continues with some fun buzzwords:

This year, the Center for Medicare and Medicaid Innovation (CMMI) took a ground-breaking step, creating policy aligning with multi-level equity science and targeting resources based on both individual-level and exposome (neighborhood-level) disadvantage in a cost-neutral way.

This sort of bureaucratic language should not in itself be taken to imply that there’s anything wrong with the Area Deprivation Index. A successful tool in this space will get used by all sorts of agencies, and bureaucracy will unavoidably spring up around it.

Let’s read further and see how they respond to the criticism. Here they go:

Hospitals located in high ADI neighborhoods tend to be hit hardest financially, suggesting health equity aligned policies may offer them a lifeline. Yet recently, CMS has been criticized for selecting ADI for use in its HEBA. According to behavioral economics theory, potential losers will always fight harder than potential winners, and in a budget-neutral innovation like ACO REACH there are some of both.

I’m not sure the behavioral economics framing makes sense here. Different measures of deprivation will correspond to different hospitals getting extra funds, so in that sense both sides in the debate represent potential winners and losers from different policies.

They continue:

CMS must be allowed time to evaluate the program to determine what refinements to its methodology, if any, are needed. CMS has signaled openness to fine-tune the HEBA if needed in the future. Ultimately, CMS is correct to act now with the tools of today to advance health equity.

Sure, but then you could use one of the other available indexes, such as the Social Deprivation Index or the Social Vulnerability Index, right? It seems there are two questions here: first, whether to institute this new policy to “incentivize medical groups to work with low-income populations”; second, whether there are any available measures of deprivation that make sense for this purpose; third, if more than one measure is available, which one to use.

So now on to their defense of the Area Deprivation Index:

The NIH-funded, publicly availably ADI is an extensively validated neighborhood-level (exposome) measure that is tightly linked to health outcomes in nearly 1000 peer-reviewed, independent scientific publications; is the most commonly used social exposome measure within NIH-funded research today; and undergoes a rigorous, multidisciplinary evaluation process each year prior to its annual update release. Residing in high ADI neighborhoods is tied to biological processes such as accelerated epigenetic aging, increased disease prevalence and increased mortality, poor healthcare quality and outcomes, and many other health factors in research studies that span the full US.

OK, so ADI is nationally correlated with various bad outcomes. This doesn’t yet address the concern of the measure having problems locally.

But they do get into the details:

A recent peer-reviewed article argued that the monetary values in the ADI should be re-weighted and an accompanying editorial noted that, because these were “variables that were measured in dollars,” they made portions of New York State appear less disadvantaged than the authors argued they should be. Yet New York State in general is a very well-resourced state with one of the ten highest per capita incomes in the country, reflected in their Medicaid Federal Medical Assistance Percentage (FMAP). . . .

Some critics relying on face validity claim the ADI does not perform “well” in cities with high housing costs like New York, and also California and Washington, DC, and suggest that a re-weighted new version be created, again ignoring evidence demonstrating the strong link between the ADI and health in all kinds of cities including New York (also here), San Francisco, Houston, San Antonio, Chicago, Detroit, Atlanta, and many others. . . .

That first paragraph doesn’t really address the question, as the concerns about the South Bronx not having a high deprivation index are about one part of New York, not “New York State in general.” But the rebuttal article does offer two links about New York specifically, so let me take a look:

Associations between Amygdala-Prefrontal Functional Connectivity and Age Depend on Neighborhood Socioeconomic Status:

Given the bimodal distribution of ADI percentiles in the current sample, the variable was analyzed in three groups: low (90–100), middle (11–89), and high neighborhood SES.

To get a sense of things, I went to the online Neighborhood Atlas and grabbed the map of national percentiles for New York State:
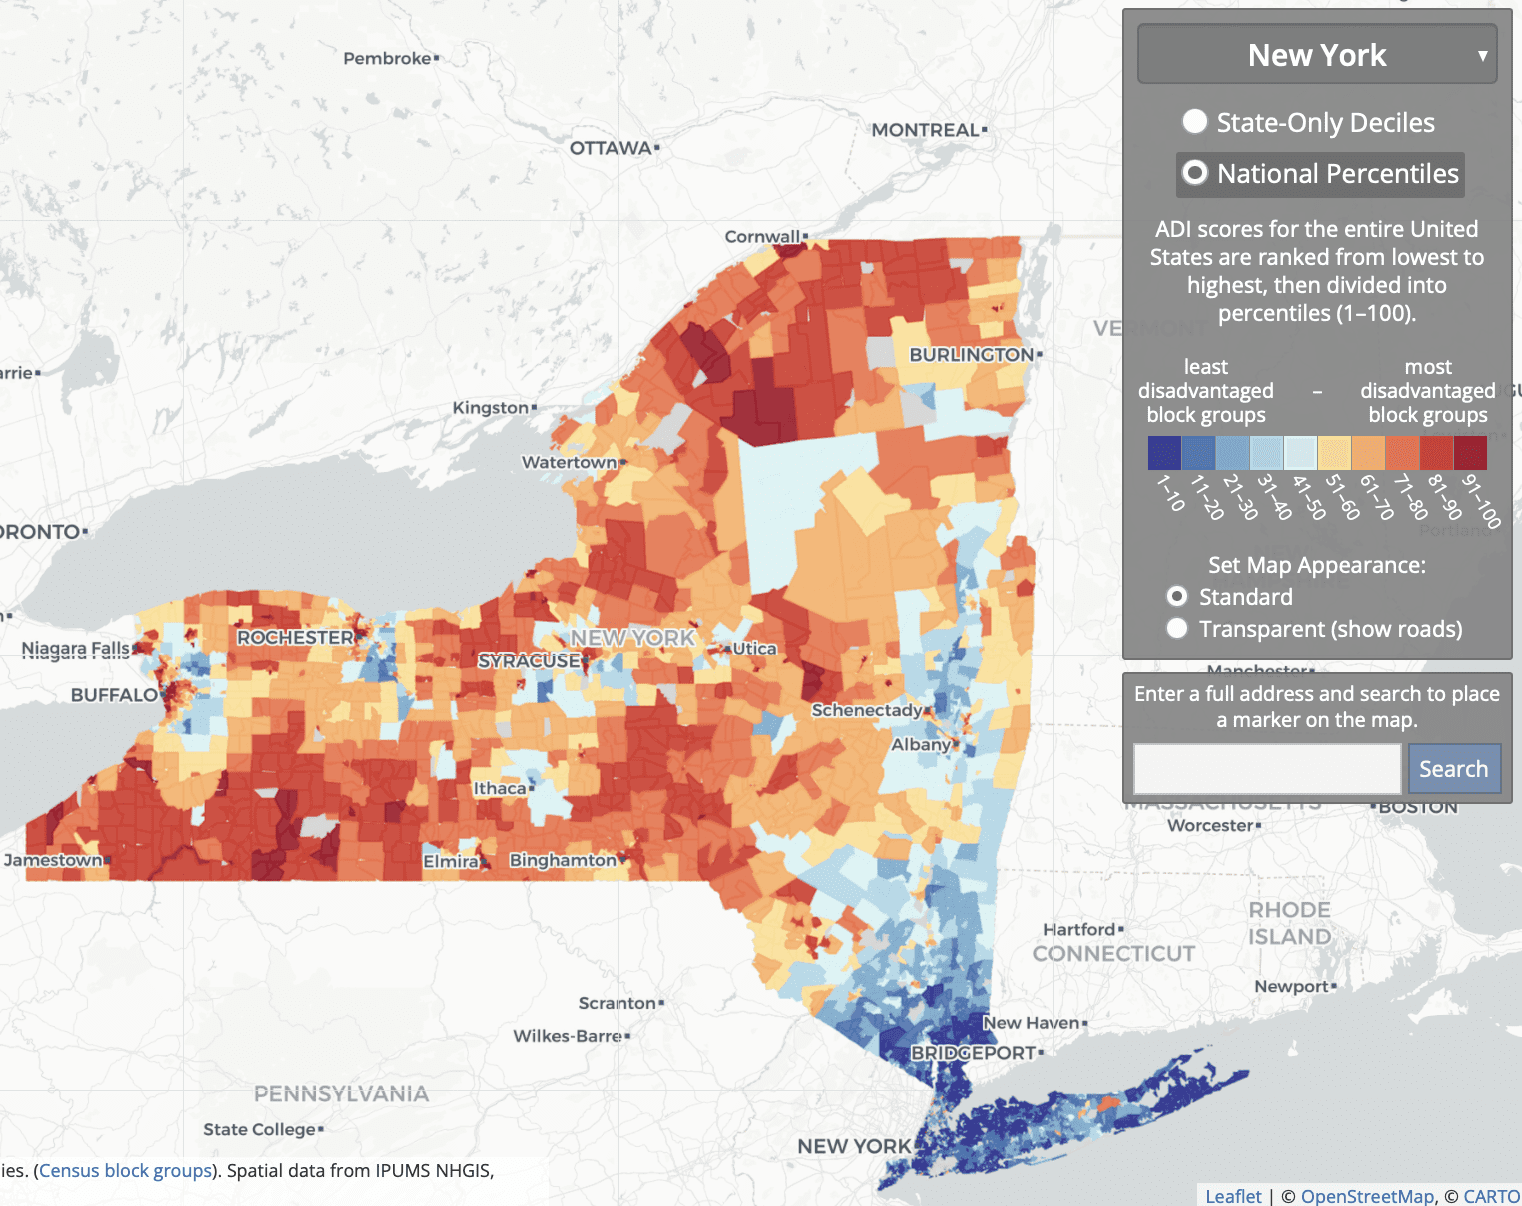
So what they’re doing is comparing some rich areas of NYC and its suburbs; to some low- and middle-income parts of the city, suburbs, and upstate; to some low-income rural and inner-city areas upstate.

Association Between Residential Neighborhood Social Conditions and Health Care Utilization and Costs:

Retrospective cohort study. Medicare claims data from 2013 to 2014 linked with neighborhood social conditions at the US census block group level of 2013 for 93,429 Medicare fee-for-service and dually eligible patients. . . . Disadvantaged neighborhood conditions are associated with lower total annual Medicare costs but higher potentially preventable costs after controlling for demographic, medical, and other patient characteristics. . . . We restricted our sample to patients with 9-digit residential zip codes available in New York or New Jersey . . .

I don’t see the relevance of these correlations to the criticisms of the ADI.

To return to our main thread, the rebuttal summarizes:

The ADI is currently the most validated scientific tool for US neighborhood level disadvantage. This does not mean that other measures may not eventually also meet this high bar.

My problem here is with the term “most validated.” I’m not sure how to take this, given that all this validation didn’t seem to have shown that problem with the South Bronx etc. But, sure, I get their general point: When doing research, better to go with the devil you know, etc.

The rebuttal authors add:

CMS should continue to investigate all options, beware of conflicts of interest, and maintain the practice of vetting scientific validated, evidence-based criteria when selecting a tool to be used in a federal program.

I think we can all agree on that.

Beyond general defenses of the ADI on the grounds that many people use it, the rebuttal authors make an interesting point about the use of neighborhood-level measures more generally:

Neighborhood-level socioeconomic disadvantage is just as (and is sometimes more) important than individual SES. . . . These factors do not always overlap, one may be high, the other low or vice versa. Both are critically important in equity-focused intervention and policy design. In their HEBA, as aligned with scientific practice, CMS has included one of each—the ADI captures neighborhood-level factors, and dual Medicare and Medicaid eligibility represents an individual-level factor. Yet groups have mistakenly conflated individual-level and neighborhood-level factors, wrongly suggesting that neighborhood-level factors are only used because additional individual factors are not readily available.

They link to a review article. I didn’t see the reference there to groups claiming that neighborhood-level factors are only used because additional individual factors are not readily available, but I only looked at that linked article quickly so I probably missed the relevant citation.

The above are all general points about the importance of using some neighborhood-level measure of disadvantage.

But what about the specific concerns raised with the ADI, such as the labeling most of the South Bronx as being low disadvantage (in the 10th to 30th percentile nationally)? Here’s what I could find in the rebuttal:

These assertions rely on what’s been described as “the weakest of all possible arguments”: face validity—defined as the appearance of whether or not something is a correct measurement. This is in contrast to empirically-driven tests for construct validity. Validation experts universally discredit face validity arguments, classifying them as not legitimate, and more aligned with “marketing to a constituency or the politics of assessment than with rigorous scientific validity evidence.” Face validity arguments on their own are simply not sufficient in any rigorous scientific argument and are fraught with potential for bias and conflict of interest. . . .

Re-weighting recommendations run the risk of undermining the strength and scientific rigor of the ADI, as any altered ADI version no longer aligns with the highly-validated original Neighborhood Atlas ADI methodology . . .

Some have suggested that neighborhood-level disadvantage metrics be adjusted to specific needs and areas. We consider this type of change—re-ranking ADI into smaller, custom geographies or adding local adjustments to the ADI itself—to be a type of gerrymandering. . . . A decision to customize the HEBA formula in certain geographies or parts of certain types of locations will benefit some areas and disservice others . . .

I disagree with the claim that face validity is “the weakest of all possible arguments.” For example, saying that a method is good because it’s been cited thousands of times, or saying that local estimates are fine because the national or state-level correlations look right, those are weaker arguments! And if validation experts universally discredit face validity arguments . . . ummmm, I’m not sure who are the validation experts out there, and in any case I’d like to see the evidence of this purportedly universal view. Do validation experts universally think that North Korea has moderate electoral integrity?

The criticism

Here’s what the critical article lists as limitations of the ADI:

Using national ADI benchmarks may mask disparities and may not effectively capture the need that exists in some of the higher cost-of-living geographic areas across the country. The ADI is a relative measure for which included variables are: median family income; percent below the federal poverty level (not adjusted geographically); median home value; median gross rent; and median monthly mortgage. In some geographies, the ADI serves as a reasonable proxy for identifying communities with poorer health outcomes. For example, many rural communities and lower-cost urban areas with low life expectancy are also identified as disadvantaged on the national ADI scale. However, for parts of the country that have high property values and high cost of living, using national ADI benchmarks may mask the inequities and poor health outcomes that exist in these communities. . . .

They recommend “adjusting the ADI for variations in cost of living,” “recalibrating the ADI to a more local level,” or “making use of an absolute measure such as life expectancy rather than a relative measure such as the ADI.”

There seem to be two different things going on here. The first is that ADI is a socioeconomic measure, and it could also make sense to include a measure of health outcomes. The second is that, as a socioeconomic measure, ADI seems to have difficulty in areas that are low income but with high housing costs.

My summary

1. I agree with my correspondent’s email that led off this post. The criticisms of the ADI seem legit—indeed, they remind me a bit of the Human Development Index, which a similar problem of giving unreasonable summaries that can be attributed to someone constructing a reasonable-seeming index and then not looking into the details; see here for more. There was also the horrible, horrible Electoral Integrity Index, which had similar issues of face validity that could be traced back to fundamental issues of measurements.

2. I also agree with my correspondent that the rebuttal article is bad for several reasons. The rebuttal:
– does not ever address the substantive objections;
– doesn’t seem to recognize that, just because a measure gives reasonable national correlations, that doesn’t mean that it can’t have serious local problems;
– leans on an argument-from-the-literature that I don’t buy, in part out of general distrust of the literature and in part because none of the cited literature appears to address the concerns on the table;
– presents a ridiculous argument against the concept of face validity.

Face validity—what does that mean?

Let me elaborate upon that last point. When a method produces a result that seems “on its face” to be wrong, that does not necessarily tell us that the method is flawed. If something contradicts face validity, that tells us that it contradicts our expectations. It’s a surprise. One possibility is that our expectations were wrong! Another possibility is that there is a problem with the measure, in which case the contradiction with our expectations can help us understand what went wrong. That’s how things went with the political science survey that claimed that North Korea was a moderately democratic country, and that’s how things seem to be going with the Area Deprivation Index. Even if it has thousands of citations, it can still have flaws. And in this case, the critics seem to have gone in and found where some of the flaws are.

In this particular example, the authors of the rebuttal have a few options.

They could accept the criticisms of their method and try to do better.

Or they could make the affirmative case that all these parts of the South Bronx, southeast D.C., etc., are not actually socioeconomically deprived. Instead they kind of question that these areas are deprived (“New York State in general is a very well-resourced state”) but without quite making that claim. I think one reason they’re stuck in the middle is politics. Public health is in general coming from the left side of the political spectrum and, from the left, if an area is poor and has low life expectancy, you’d call it deprived. From the right, you could argue that these poor areas already get tons of government support and that all this welfare dependence just compounds the problem. From a conservative perspective, you might argue that these sorts of poor neighborhoods are not “deprived” but rather are already oversaturated with government support. But I don’t think we’d be seeing much of that argument in the health-disparities space.

Or they could make a content-low response without addressing the problem. Unfortunately, that’s the option they chose.

I have no reason to think they’ve chosen to respond poorly here. My guess is that they’re soooo comfortable with their measure, soooooo sure it’s right, that they just dismissed the criticism without ever thinking about it. Which is too bad. But now they have this post! Not too late for them to do better. Tomorrow’s another day, hey!

P.S. My correspondent adds:

The original article criticizing the ADI measure has some map graphic sins that any editor should have removed before publication. Here are some cleaner comparisons of the city data. The SDI measure in those plots is the Social Deprivation Index from Robert Graham Center.

Washington, D.C.:

New York City:

Boston:

San Francisco area:

A quote on data transparency—from 1662!

Michael Nelson writes:

Recently, I came across a quote in Irwin (1935), taken from 19th century sources on Graunt (1662). Todhunter said of Graunt, who apparently was the first (English?) person to get the idea of using data gathered on the plague to compute and publish life tables, that:

Graunt was careful to publish with his deductions the actual returns from which they were obtained, comparing himself, when so doing, to “a silly schoolboy coming to say his lesson to the world (that peevish and tetchie master) who brings a bundle of rods, wherewith to be whipped for every mistake he has committed.” Many subsequent writers have betrayed more fear of the punishment they might be liable to on making similar disclosures, and have kept entirely out of sight the sources of their conclusions. The immunity they have thus purchased from contradiction could not be obtained but at the expense of confidence in their results.

I have a new hero.

Those 1662 dudes, they knew what they were talking about.

Do Ultra-Processed Data Cause Excess Publication and Publicity Gain?

Ethan Ludwin-Peery writes:

I was reading this paper today, Ultra-Processed Diets Cause Excess Calorie Intake and Weight Gain (here, PDF attached), and the numbers they reported immediately struck me as very suspicious.

I went over it with a collaborator, and we noticed a number of things that we found concerning. In the weight gain group, people gained 0.9 ± 0.3 kg (p = 0.009), and in the weight loss group, people lost 0.9 ± 0.3 kg (p = 0.007). These numbers are identical, which is especially suspicious since the sample size is only 20, which is small enough that we should really expect more noise. What are the chances that there would be identical average weight loss in the two conditions and identical variance? We also think that 0.3 kg is a suspiciously low standard error for weight fluctuation.

They also report that weight changes were highly correlated with energy intake (r = 0.8, p < 0.0001). This correlation coefficient seems suspiciously high to us. For comparison, the BMI of identical twins is correlated at about r = 0.8, and about r = 0.9 for height. Their data is publicly available here, so we took a look and found more to be concerned about. They report participant weight to two decimal places in kilograms for every participant on every day. Kilograms to two decimal places should be pretty sensitive (an ounce of water is about 0.02 kg), but we noticed that there were many cases where the exact same weight appeared for a participant two or even three times in a row. For example participant 21 was listed as having a weight of exactly 59.32 kg on days 12, 13, and 14, participant 13 was listed as having a weight of exactly 96.43 kg on days 10, 11, and 12, and participant 6 was listed as having a weight of exactly 49.54 kg on days 23, 24, and 25.

In fact this last case is particularly egregious, as 49.54 kg is exactly one kilogram less, to two decimal places, than the baseline for this participant’s weight when they started, 50.54 kg. Participant 6 only ever seems to lose or gain weight in increments of 0.10 kilograms. Similar patterns can also be seen in the data of other participants.

We haven’t looked any deeper yet because we think this is already cause for serious concern. It looks a lot like heavily altered or even fabricated data, and we suspect that as we look closer, we will find more red flags. Normally we wouldn’t bother but given that this is from the NIH, it seemed like it was worth looking into.

What do you think? Does this look equally suspicious to you?

He and his sister Sarah followed up with a post, also there are posts by Nick Brown (“Some apparent problems in a high-profile study of ultra-processed vs unprocessed diets”) and Ivan Oransky (“NIH researcher responds as sleuths scrutinize high-profile study of ultra-processed foods and weight gain”).

I don’t really have anything to add on this one. Statistics is hard, data analysis is hard, and when research is done on an important topic, it’s good to have outsiders look at it carefully. So good all around, whatever happens with this particular story.

“Nobody’s Fool,” by Daniel Simons and Christopher Chabris

This new book, written by two psychology researchers, is an excellent counterpart to Lying for Money by economist Dan Davies, a book that came out a few years ago but which we happened to have discussed recently here. Both books are about fraud.

Davies gives an economics perspective, asking what are the conditions under which large frauds will succeed, and he focuses on the motivations of the fraudsters: often they can’t get off the fraud treadmill once they’re on it. In contrast, Simons and Chabris focus on the people who get fooled by frauds; the authors explain how it is that otherwise sensible people can fall for pitches that are, in retrospect, ridiculous. The two books are complementary, one focusing on supply and one on demand.

My earlier post was titled “Cheating in science, sports, journalism, business, and art: How do they differ?” Nobody’s Fool had examples from all those fields, and when they told stories that I’d heard before, their telling was clear and reasonable. When a book touches on topics where the reader is an expert, it’s a good thing when it gets it right. I only wish that Simons and Chabris had spent some discussing the similarities and differences of cheating in these different areas. As it is, they mix in stories from different domains, which makes sense from a psychology perspective of the mark (if you’re fooled, you’re fooled) but gives less of a sense of how the different frauds work.

For the rest of this review I’ll get into some different interesting issues that arose in the book.

Predictability. On p.48, Simons and Chabris write, “we need to ask ourselves a somewhat paradoxical question: ‘Did I predict this?’ If the answer is ‘Yes, this is exactly what I expected,’ that’s a good sign that you need to check more, not less.” I see what they’re saying here: if a claim is too good to be true, maybe it’s literally too good to be true.

On the other hand, think of all the junk science that sells itself on how paradoxical it is. There’s the whole Freakonomics contrarianism thing. The whole point of contrarianism is that you’re selling people on things that were not expected. If a claim is incredible, maybe it’s literally incredible. Unicorns are beautiful, but unicorns don’t exist.

Fixed mindsets. From p.61 and p.88, “editors and reviewers often treat the first published study on a topic as ‘correct’ and ascribe weaker or contradictory results in later studies to methodological flaws or incompetence. . . . Whether an article has been peer-reviewed is often treated as a bright line that divides the preliminary and dubious from the reliable and true.” Yup.

There’s also something else, which the authors bring up up in the book: challenging an existing belief can be costly. It creates motivations for people to attack you directly; also it seems to me that the standards for criticism of published papers are often much higher than for getting the original work accepted for published in the first place. Remember what happened to the people who squealed on Lance Armstrong? He attacked them. Or that Holocaust denier who sued his critic? The kind of person who is unethical enough to cheat could also be unethical enough to abuse the legal system.

This is a big deal. Yes, it’s easy to get fooled. And it’s even easier to get fooled when there are social and legal structures that can make it difficult for frauds to publicly be revealed.

Ask more questions. This is a good piece of advice, a really important point that I’d never thought about until reading this book. Here it is: “When something seems improbable, that should prompt you to investigate by asking more questions [emphasis in the original]. These can be literal questions . . . or they can be asked implicitly.”

Such a good point. Like so many statisticians, I obsess on the data in front of me and don’t spend enough time thinking about gathering new data. Even something as a simulation experiment is new data.

Unfortunately, when it comes to potential scientific misconduct, I don’t usually like asking people direct questions—the interaction is just too socially awkward for me. I will ask open questions, or observe behavior, but that’s not quite the same thing. And asking direct questions would be even more difficult in a setting where I thought that actual fraud was involved. I’m just more comfortable on the outside, working with public information. This is not to disagree with the authors’ advice to ask questions, just a note that doing so can be difficult.

The fine print. On p.120, they write, “Complacent investors sometimes fail to check whether the fine print in an offering matches the much shorter executive summary.” This happens in science too! Remember the supposedly “long-term” study that actually lasted only three days? Or the paper whose abstract concluded, “That a person can, by assuming two simple 1-min poses, embody power and instantly become more powerful has real-world, actionable implications,” even though the study itself had no data whatsoever on people “becoming more powerful”? Often the title has things that aren’t in the abstract, and the abstract has things that aren’t in the paper. That’s a big deal considering: (a) presumably many many more people read the title than the abstract, and many many more people read the abstract than the paper, (b) often the paper is paywalled so that all you can easily access are the title and abstract.

The dog ate my data. From p.123: “Many of the frauds that we have studied involved a mysterious, untimely, or convenient disappearance of evidence.” Mary Rosh! I’m also reminded of Dan Davies’s famous quote, “Good ideas do not need lots of lies told about them in order to gain acceptance.”

The butterfly effect. I agree with Simons and Chabris to be wary of so-called butterfly effects: “According to the popular science cliché, a butterfly flapping its wings in Brazil can cause a tornado in Texas.” I just want to clarify one thing which we discuss further in our paper on the piranha problem. As John Cook wrote in 2018:

The butterfly effect is the semi-serious claim that a butterfly flapping its wings can cause a tornado half way around the world. It’s a poetic way of saying that some systems show sensitive dependence on initial conditions, that the slightest change now can make an enormous difference later. . . . The lesson that many people draw from their first exposure to complex systems is that there are high leverage points, if only you can find them and manipulate them. They want to insert a butterfly to at just the right time and place to bring about a desired outcome.

But, Cook explains, that idea is wrong. Actually:

Instead, we should humbly evaluate to what extent it is possible to steer complex systems at all. . . . The most effective intervention may not come from tweaking the inputs but from changing the structure of the system.

The point is that, to the extent the butterfly effect is a real thing, the point is that small interventions can very occasionally have large and unpredictable results. This is pretty much the opposite of junk social science of the “priming” or “nudge” variety—for example, the claim that flashing a subliminal smiley face on a computer screen will induce large changes in attitudes toward immigration—which posit reliable and consistent effects from such treatments. That is: if you really take the butterfly idea seriously, you should disbelieve studies that purport to demonstrate those sorts of bank-shot claims about the world.

Clarke’s Law

One more thing.

In his book, Davies talks about fraud in business. There’s not a completely sharp line dividing fraud from generally acceptable sharp business practices; still, business cheating seems like a clear enough topic that it can make sense to write a book about “Lying for Money,” as Davies puts it.

As discussed above, Simons and Chabris talk about people being fooled by fraud in business but also in science, art, and other domains. In science in particular, it seems to me that being fooled by fraud is a minor issue compared to the much larger problem of people being fooled by bad science. Recall Clarke’s law: Any sufficiently crappy research is indistinguishable from fraud.

Here’s the point: Simons and Chabris focus on the people being fooled rather than the people running the con. That’s good. It’s my general impression that conmen are kind of boring as people. Their distinguishing feature is a lack of scruple. Kind of like when we talk about findings that are big if true. And once you’re focusing on people being fooled, there’s no reason to restrict yourself to fraud. You can be just as well fooled by research that is not fraudulent, just incompetent. Indeed, it can be easier to be fooled by junk science that isn’t fraudulent, because various checks for fraud won’t find the problem. That’s why I wrote that the real problem of that nudge meta-analysis is not that it includes 12 papers by noted fraudsters; it’s the GIGO of it all. You know that saying, The easiest person to fool is yourself?

In summary, “How do we get fooled and how can we avoid getting fooled in the future?”, is a worthy topic for a book, and Simons and Chabris did an excellent job. The next step is to recognize that “getting fooled” does not require a conman on the other side. To put it another way, not every mark corresponds to a con. In science, we should be worried about being fooled by honest but bad work, as well as looking out for envelope pushers, shady operators, and out-and-out cheats.