This is an interesting one. It’s a polite but spirited debate between some historians and economists regarding a claim about early twentieth-century French history. This would seem to be an area only of interest to specialists, but the topic is support for fascist and fascist-adjacent parties, which unfortunately is a major concern of our times, and not just in France. For a quick background on the history you could take a look at this from journalist Geoffrey Wheatcroft.
Ultimately, this scholarly debate does not tell us much about support for fascism—as is typical in social science, the research only captures some small part of the story—so my treatment of the controversy will focus more on statistical issues than political interpretations.
But here’s the basic summary. An article was published last year in an economics journal, concluding that “home municipalities of French line regiments arbitrarily rotated under Philippe Pétain’s generalship through the heroic World War I battlefield of Verdun diverge politically thereafter . . . under Pétain’s collaborationist Vichy regime (1940–1944), they raise 7 percent more active Nazi collaborators per capita.” Some historians pointed out problems with the data and methods in that article. The economists then replied, arguing that their data and methods were just fine, and not yielding an inch except on one small error that was introduced be an editor in a shorter, popular version of their article that they’d published in a magazine.
I’ll describe the debate and then discuss what seem to me to be the key issues.
The debate
Thomas Blanchet writes:
I wanted to bring to your attention a controversy regarding a paper recently published in the American Economic Review: “Heroes and Villains: The Effects of Heroism on Autocratic Values and Nazi Collaboration in France.” While the paper is obviously in English, the controversy has been happening in French, so academics outside of France may be unaware of it.
The article pretends to find a causal link between serving under the General Pétain in WWI during one of its biggest battle (Verdun), and subsequent collaboration with the Nazi regime in WWII, under France’s collaborationist regime, which was headed by Pétain as well.
When the working paper came out, historians started to take it apart.
– They wrote a first takedown.
– The authors replied
– And the critics replied again.
I’m linking to the Google translations, which are actually quite OK.As is often the case in these situations, you have to filter out a certain amount of skepticism for quantitative methods coming from the historians. But they make pretty damning points.
The treatment variable is the random assignment of soldiers from given towns to the various regiments in 1914. But it turns out that by the time the Verdun battle happened (in 1916), soldiers had been severely shuffled around:
Since the authors claim to attach a municipality to a regiment, despite the subsequent mixing, we must conclude that they assume that a significant part of the members of the regiment continued to come from the municipalities which originally depended on the recruiting office. Let’s take at random the example of Châteauroux, headquarters of the 90th infantry regiment, and let’s look at the deaths for France between August 1914 and December 1916, among the infantrymen of the 1914 class who passed through the commune’s recruitment office. Only 10% of them were at the time of their death within the 90th regiment : a proportion comparable to those who were part of the 13th (based in Nevers), the 79th (Nancy, Neufchâteau), the 85th (Cosne), and the 95th (Bourges). Conversely, let’s look at the deaths for France between August 1914 and December 1916, among the infantrymen of the 1914 class within the 90th regiment : only 10% were recruited in Châteauroux, that is to say less than in Limoges or in Guéret.
Then, for their outcome variable (share of people who collaborated with the Nazi regime), they use data from a list of collaborators that shows all the signs of being pretty janky:
This is a file in no way “declassified”, and not placed in an archive. Little is known about this list, other than that it was in the possession of Colonel Paillole, a former Giraudist soldier who was a member of the secret services of Free France until November 1944. The authors speak of a “collected” list in 1944-1945 under the supervision of Paul Paillole » : a double error, therefore, since he left his functions at the end of 1944, and there is no indication that he was at the origin of this document. They then write that the file would include “the names of all the members of the French Popular Party (PPF), which are now part of our data”: a new error, since 9,403 names are attributed to the PPF, while it includes, according to estimates, between 40,000 and 50,000 members. It is equally false to write that the list “captures the entire spectrum of collaboration, from economic collaboration to membership in collaborationist parties or paramilitary groups”: according to the author’s admission, although not very rigorous, having makes this list known, economic collaboration has a negligible place in it. He spoke, for this document, of a “list made up of odds and ends, with a dubious restitution in its form, as if it had been repeatedly retouched, possibly redacted, or lengthened” : it is difficult to see there a solid basis for quantification.
So both the treatment and the outcome seem pretty questionable.
The authors had a reply. I didn’t find it very convincing, and it contains this perfect encapsulation of the “what doesn’t kill my statistical significance makes it stronger” mentality:
The fact that in 1915, the infantry regiments broke away from their local roots at the start of the war to incorporate troops from several departments, shows the strength and robustness of the statistical relationship that we put forward in our analysis. In statistical terms, the fact that these regiments, which were originally anchored locally, were subsequently mixed, leads us to underestimate the real effect of the rotation in Verdun on collaboration.
It is a bit unsettling that the paper got published in the AER in spite of all that. The criticism was out before the paper was accepted. (Obviously the criticism having been done in French by historians didn’t help.)
I found that story to be a nice case of very questionable data analysis making its way to a top journal, and I felt it would be interesting to share it outside of the French historians’ bubble.
The issues
It’s hard for me to adjudicate this one, as it involves a lot of specialized knowledge, and the people on both sides of this debate know a lot more about this bit of history than I do. So I’ll just try to lay out the key issues in contention:
1. Where were the soldiers from?
From the published article:
On August 2, 1914, France ordered the general mobilization of every man between 20 and 48 years of age: 92.76 percent of 1914 France’s municipalities sent troops that served in one of the 153 line regiments that were rotated through the Battle of Verdun, and 56.86 percent of all French municipalities did so in one of the 92 regiments rotated through under Pétain’s direct command. . . . We consider a regiment to form part of the exogenous heroic network linked to Pétain if it happened to rotate through Verdun under his direct command (between February 26 and May 1), as opposed to those that were rotated between May and December, under other generals. . . .
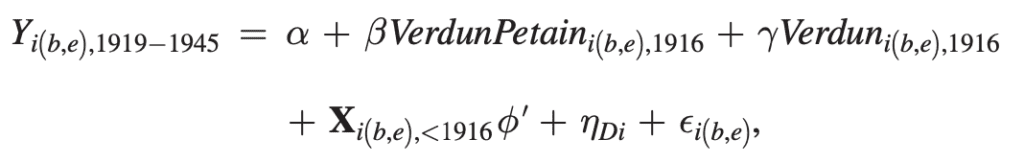
Here i is municipality (there are 35000 of these), b is the military recruitment bureau (there are 158 of these), and e is the electoral district (I couldn’t figure out how many of these were). Y is “the intensity of collaboration, measured as the logarithm of the share of collaborators listed in 1944/1945 as being from municipality i, normalized by the population,” and beta is the coefficient of interest.
These are the key predictors:
And here’s their key result:
Verdun-under-Pétain municipalities would later raise 7–9 percent more collaborators per capita compared to otherwise similar municipalities within the same department.
They also fit their model to electoral outcomes, finding:
We show that compared to other municipalities that served at Verdun in the same
department, vote shares in Verdun-under-Pétain municipalities—though very similar before World War I—diverge thereafter, and do so in manner that reflects Pétain’s own evolving views. This includes displaying 11.1 percent lower vote shares for the left as early as 1919, voting more for the right and, later, the extreme right as well.
Further these patterns culminate in the last legislative elections of the Third Republic in 1936. Between the two rounds of the legislative election, Pétain gave a highly publicized front-page interview two days before the second round in an attempt to prevent the electoral victory of the left-wing Popular Front. In the first round, we show Verdun-under-Pétain municipalities display a 7.7 percent higher vote for the right, including 2.6 percent for the extreme-right blueshirts of the Francisme Party. Further, despite the fact that the two rounds of the elections were just one week apart, we show there is a dramatic 7 percentage point left-to-right swing between parties participating in the second round just after Pétain’s speech.

Relevant to their causal identification is this map from the published paper:
Also this:
Consistent with the arbitrary nature of the regimental rotation system, we show that municipalities that raised regiments that served at Verdun under Pétain’s direct command (henceforth “Verdun-under-Pétain municipalities”) are very similar along a broad range of pre-World War I characteristics to others. Most importantly, we hand collected novel voting data at the highly granular level of France’s (then) 34,947 municipalities to show that this includes similar vote shares for each political party in the last prewar election in 1914.
I’m not sure what to think. On one hand, there seem to have been differences between these two groups of municipalities in their political trajectories between 1914 and 1944. On the other hand, the chunks in that above map are pretty big; they don’t look like anything close to 35000 or even 158 independent data points. It would be good to see some before/after scatterplots with one dot per chunk, to get a sense of what is going on here. Maybe also scatterplots with one dot per military recruitment bureau or something else that’s more aggregated than municipality. Actually, scatterplots of municipalities could be helpful too, or maybe not, as the data might be too noisy for us to see anything.
It’s the usual story with correlation in observational comparisons: you want to look at the data in many different ways to see what you’re comparing.
2. The list of collaborators
Regression coefficients and averages can be hard to interpret. For example, the published article says that the fitted model “implies that Verdun-under-Pétain municipalities have 0.598 additional collaborators, on average, compared to Verdun-not-Pétain municipalities”; this is “with respect to a mean number of 2.42 collaborators in a municipality.” Setting aside the hyper-precision—given the uncertainty in this process, it would be more appropriate to replace that “0.598” by “0.6”—there would at first seem to be a concern about the scale of the result. An increase of 0.6 collaborators in a town isn’t very much! The point is that the percentage increase is large: presumably there were many more than 2.42 collaborators in these towns, and the available data represent only a very small proportion of the actual value. That’s fine—but then the comparison in the paper is not necessarily revealing any difference in the number of collaborators in these different towns; it could just as well represent a difference in probability of inclusion in the dataset. From that perspective, the details regarding this list could be very relevant to our interpretation of this result.
3. Misclassification
Does it matter that, by 1916, some large proportion of the solders on the front didn’t come from the regions assigned to them in the dataset? The critics say yes, this is a big problem of measurement; the original authors say no, they are getting a sort of reduced-form or intent-to-treat estimate which should still be directionally correct.
The authors write, “In statistical terms, the fact that these regiments, which were originally anchored locally, were subsequently mixed, leads us to underestimate the real effect of the rotation in Verdun on collaboration”—which should be true in expectation if the mixing error is independent of the outcome—but is also missing a couple parts of the story. The first problem here is that misclassification of the predictor doesn’t just decrease the underlying effect size; it also decreases the effect size relative to uncertainty. That is, the signal becomes weaker relative to noise, which leads to higher type M (magnitude) and S (sign) errors. Second, when the main signal becomes smaller, it is more likely to get overwhelmed by other effects. This returns us to the point that the study is observational, a comparison of later political behavior in different regions of France. There could be all sorts of differences between the regions labeled as treatment and control. From that perspective, the analysis is leaning heavily on the finding of no difference in voting patterns before 1916.
Summary
That’s what I’ve got. It’s an observational study. I wouldn’t be inclined to take the collaborators data so seriously, as the numbers just seem too small and thus the results would be sensitive to possible systematic errors. For the electoral analysis, the question is how do the two groups of regions differ, and what else was going on between 1916 and 1940 in these different regions.
P.S. More here from David Weakliem. It seems that the statistical evidence isn’t so clear; as Weakliem puts it, “here is only weak evidence, at best, that service under Pétain increased the number of collaborators.” Given that the data on collaborators was so sparse—that is, the number of collaborators in the data was such a small fraction of the number of collaborators in these towns at the time—I’m also concerned that nonuniformity in data collection would overwhelm any patterns.
https://law.stackexchange.com/questions/73561/why-isnt-a-draft-conscription-slavery
Apparently France even invented the modern practice of conscription. Did the average french guy really prefer a government that would not-enslave him and ship him to the trenches to whatever under the nazis?
World War I showed that the accepted leadership of Europe’s great nations had extremely little regard for the lives of their citizens. Ultimately, governments should provide some protection from evils, but the governments of that time were quite willing to order thousands to march through thick mud and concertina wire toward machine guns in hardened positions, and to repeat this ritual of unprofitable ritual sacrifice over and over again. The leaders of all the nations proved that they didn’t deserve their power. The subsequent development of Communism in Russia, Nazism in Germany, and collaborationism in France was inevitable given the horrific recklessness of the “legitimate” governments of those nations. I would not be surprised if people serving under Pétain disdained his national interests. Hitler probably understood this and appointed Pétain to head the Vichy regime to rub the French peoples’ noses in it.
Whether the authors of the article in question make their case is a separate matter, of course.
“Ultimately, governments should provide some protection from evils…”
It’s not clear that this was their recognized function in 1914. From what I understand it’s more like a view that was emerging out of the fog after millenia tyrannical rule by elites who generally had little if any regard for the average person, and viewed their own positions as more of a birthright to wealth than anything having to do with “responsibility” for “protection” of citizens.
In France the previous century had been most troublesome, starting with Napoleon in the leadership and ending after several revolutions and wars. And while the French people were fighting for their own freedom over the course of the centry, hundreds of thousands died in Frances’ colonial conquests abroad, so apparently the French weren’t that impressed with the idea that people should be free from domination and that that freedom should be protected by the government.
It’s only after WWI that the idea that the government should protect its people became more or less “universally” established – “universally” meaning, as it often does, in Europe, the US and some, but not all, Commonwealth countries.
In this, it’s proper context, the “American experiment” stands out as **far** ahead of it’s time. Washington and Jefferson may have still held slaves, but their actions were a driving force for the emancipation of *all of humanity* – a process which, tragically, is still proceeding. And the American victory over the British was a powerful force for the spread of the idea that all humans had a *right* to be emancipated. Ultimately the wave created by this idea lead to the emancipation of slaves in Europe (many white!) and the US, eventually to the emancipation of the African colonies held by European countries.
So while I don’t dispute that the battles of WWI were a stupid waste of human life, people today will be better served by properly understanding the context in which this occurred, rather than by projecting modern values backward, as though they were apparent to anyone at the time.
OT but btw Andrew, the current election map by state,
https://www.270towin.com/maps/consensus-2024-presidential-election-forecast
shows Trump holding about 80% of the country on a geographic basis. If we just used the Sierra-Cascade crest as an international boundary, unloading less than 5% of the geographic area of the country, Trump would have a commanding lead.
This reminds me of Andrew’s argument a few years(? already?) back about aborition in Oklahoma. In that case, andrew argued that, because by polls 51% of Oklahoma supported abortion, that the Oklahoma legislature should be compelled to allow legal abortion, and implied that Oklahoma politicians were acting dishonestly or in deriliction of duty in blocking abortion rights in OK. However, the arguemt against Andrew’s position that case was the same as the argument against Democrat presidency here: abortion supporters in Oklahoma, like Democrat supporters in the current election, are overwhelmingly concentrated in a few very small geographic areas (SF, LA, SEA, NYC, BOS, CHI). Should these small areas dictate to the rest of the country? The practical answer is that at some point they won’t be allowed to dictate. That’s why the electoral college was created in the first place: geography matters. Even if there is large popular support for some policies, if it has a very small geographic base – such as the current support for Democrats – it risks disintegration of the country. Will the homeless of Seattle and LA fight to prevent secession, as the quakers did in 1860?
Chipmunk
So you believe that geographic coverage is the “true” and “right” way to measure or implement democracy. Good to know. Some of us count people more than acres, but to each there own. And the electoral college does say that “geography matters” but not necessarily in the way you are using it. It specifically had to do with geography as delineated by state boundaries – you have simply expanded it to a statement about geographic area. So much for the original meaning of the constitution.
I didn’t find your comment worthy of your usual contributions. By the way, I own more acres of property than you do (hypothetically) – does that mean I get more votes?
chipmunk –
This reminds me of Andrew’s argument a few years(? already?)… .
Please provide a link. Your description sounds like a bad faith characterization of an augment Andrew would make.
And please, even assuming your characterization is accurate, obviously saying that majority opinion should hold sway isn’t “the same argument” as saying that popularity of opinion “on a geographical basis” should hold sway.
And please X 2, your description for “why the electoral college was created” is cartoonish.
Chipmunk:
You write that I “argued that, because by polls 51% of Oklahoma supported abortion, that the Oklahoma legislature should be compelled to allow legal abortion.”
That is false; I never argued that.
You also write that I “implied that Oklahoma politicians were acting dishonestly or in deriliction of duty in blocking abortion rights.”
That is false; I never implied that.
I appreciate everyone’s comments here, and I like that people share their different opinions on statistics, social science, literature, and all sorts of topics. I don’t appreciate when people misrepresent what I or others write.
Andrew –
That is false; I never argued that
I’m trying to figure out which would be the weirdest. That chipmunk would think you’d argue that, that he’d intentionally invent that argument and say you made it or 3, he’d think people would believe you made that argument.
Years ago there was a commenter here who would deny writing something that everyone could read they had written, above in the thread.
P.S. For those who are curious, here’s my post from a couple years ago on abortion attitudes in Oklahoma.
Last time I checked people vote, not land. Now do the same map for population
To be honest, I find that map completely unreadable. I wish they had used a two-color system. Trying to keep track of the hash lines is just impossible for me.
I thought the article was pretty convincing. The underlying argument made sense; the magnitude of the claimed effect was reasonable (ie pretty small); and they got similar results for extreme right voting and for other measures of collaboration, which wouldn’t have the same data quality issues. But I couldn’t get anything from the maps–I would rather have seen more detail on the distribution of the number of collaborators variable, especially on the high end.
It sure looks like the ‘collaborator’ dataset shows more collaborators per captica in occupied France than in Vichy France. This could be an artifact of how the list of collaborators were assembled, or it could mean that the calculus that people made between resisting and collaborating was different in occupied France than in Vichy France.
Richard:
The numbers are so low that I don’t think we can learn much from their absolute levels. That was one of my big concerns with the data, that they’re only counting some small subset of people, and it’s nothing like a random sample.