Gregory Gilderman writes:
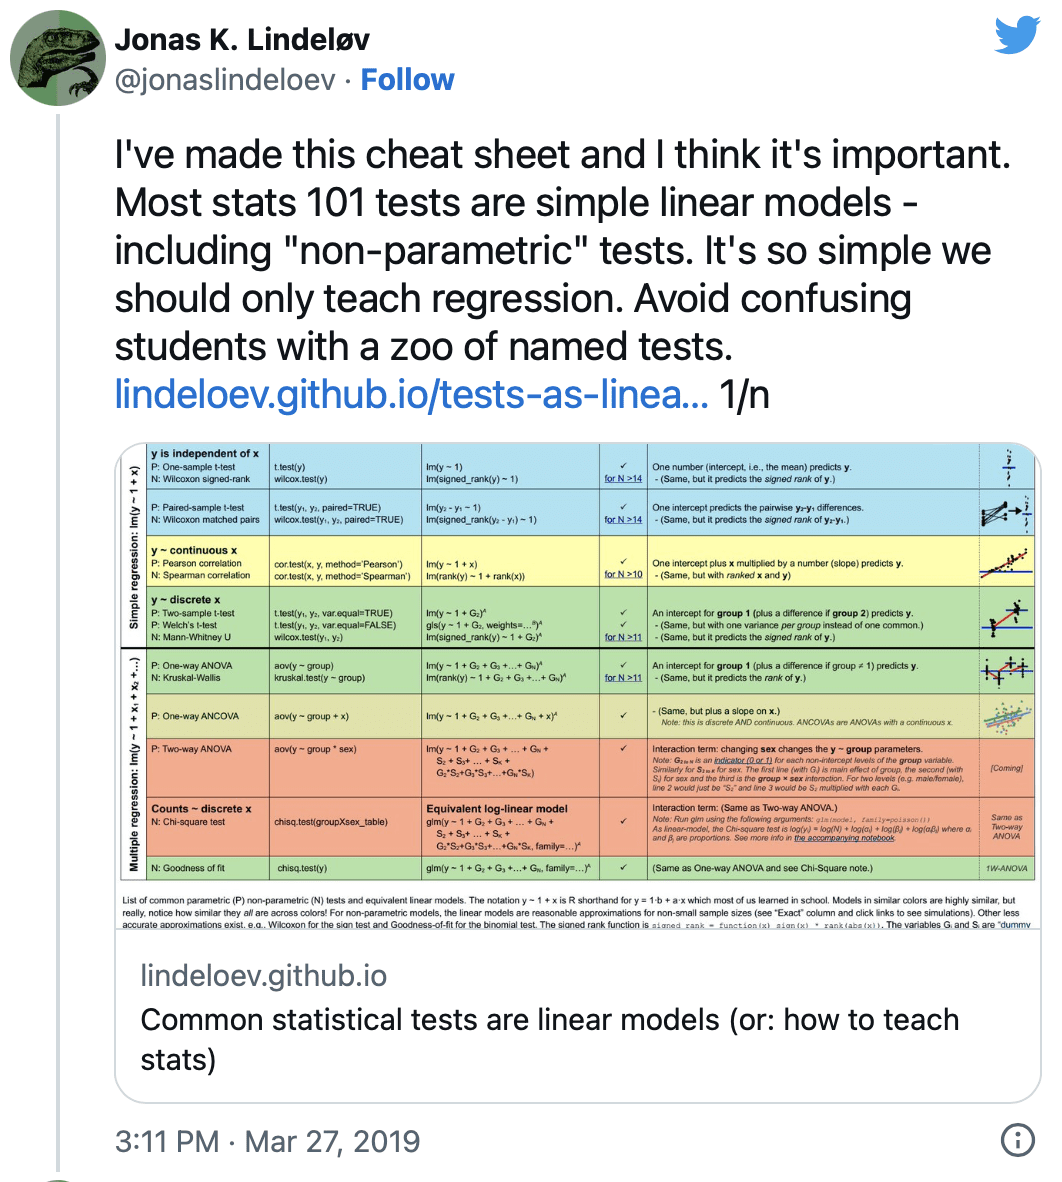
The semi-viral tweet thread by Jonas Lindeløv linked below advocates abandoning the “zoo of named tests” for Stats 101 in favor of mathematically equivalent (I believe this is the argument) varieties of linear regression:
As an adult learner of statistics, perhaps only slightly beyond the 101 level, and an R user, I have wondered what the utility of some of these tests are when regression seems to get the same job done.
I believe this is of wider interest than my own curiosity and would love to hear your thoughts on your blog.
My reply: I don’t agree with everything in Lindeløv’s post—in particular, he doesn’t get into the connection between analysis of variance and multilevel models, and sometimes he’s a bit too casual with the causal language—but I like the general flow, the idea of trying to use a modeling framework and to demystify the zoo of tests. Lindeløv doesn’t mention Regression and Other Stories, but I think he’d like it, as it follows the general principle of working through linear models rather than presenting all these tests as if they are separate things.
Also, I agree 100% with Lindeløv that things like the Wilcoxon test are best understood as linear models applied to rank-transformed data. This is a point we made in the first edition of BDA way back in 1995, and we’ve also blogged it on occasion, for example here. So, yeah, I’m glad to see Lindeløv’s post and I hope that people continue to read it.
This demystifying is good, but it only gets us partially there. The next step is to demystify the meaning of the coefficients. Ie, they assume the model you have chosen is true.
So this is incorrect:
And that last assumption is far more important than any mentioned in the tweet.
The key is to realize these models can be useful for prediction even if the coefficients are as arbitrary as weights in a neural network. But you need some theoretical justification for trying to interpret them.
I’d even guess the reason all this mystification managed to build up in the first place is that it obscures the fallacy lying at the center of the procedure.
Anon:
Yes, that quote is absolutely horrible, as he’s listing the three least important assumptions of linear regression; for background see here.
So, yeah, that’s bad But there is other good stuff at the link. As you say, he got partially there.
Andrew,
This is why I was attracted to this blog in 2015 or so. You had already pointed out the root problems (which are surrounded by a protective galaxy of secondary problems, a la Lakatos). And then rather than just complaining about it Stan got created. Building better tools is really the way forward, even if people will find ways to misuse that too.
I have two somewhat different reactions to the post. First, I think the unnecessarily confusing zoo of tests depends somewhat on the software you use. Many programs require you to choose the test from a sort of decision tree, resulting in the zoo of choices required to get the “right” test. I use JMP, and for many analyses, the appropriate test is chosen for you (an appropriate default choice) depending on the type of relationship you are investigating (and the types of variables you are using). In other words, software can partially address the issues encountered by the zoo – and in a first stat course, many of those subtle choices are not important enough to be stressed in an introductory course.
Second, one appeal of emphasizing regression over the zoo of tests is that regression invites multivariate thinking more naturally than many of the candidate tests (which are sometimes designed for specific bivariate analyses. I have seen valuable time in introductory statistics courses spend over pooled and unpooled t tests, transformations and t tests, and nonparametric tests for a difference between two samples. While all of these subtleties have their importance and value in a statistics course, they all somewhat divert attention away from the fact that multivariate analysis is more important than using the “correct” bivariate test. In my teaching, I have largely moved away from bivariate analyses except as a quick introduction to inferential concepts, moving to regression models much more quickly than I used to.
I am curious to hear reactions to these thoughts.
I was taught the zoo, and I have since left the zoo for the jungle. The beasts aren’t caged, so they are far more powerful, if also a little bit more frightening.
I don’t understand why the zoo is even still taught unless in a historical reference to relics of the past, and I would like to see someone’s arguments that students should still visit the zoo at all.
Software like you describe that automatically provides a tour guide around the zoo is even worse, as you can simply turn your brain off and listen to the comforting sound of the guide drone on.
I enjoyed your description of the zoo and jungle. One comment on your final point: the software approach I am describing does not allow you to turn off your brain – it asks you to focus on what you are trying to do. What kind of relationship are you interested in, how complex is it, is missing data an issue, etc? I agree that automation that permits you to stop thinking is bad. But automation that urges you to think about what you want to achieve and what data you have – without spending your energy deciding which of the many available tests is appropriate to use – is what I would consider helpful automation.
The problem is that “tests” are not appropriate to use … ever, or at least that’s a good enough approximation.
so you’ve tested that the difference in means between two groups is unlikely to occur if the two groups are both random numbers from a normal distribution with the same mean and different standard deviations… so what?
At least the emphasis on regression gets you thinking about a relationship like “knowledge of A allows you to predict B”
Daniel – I accept your correction. I don’t think tests are ever really appropriate – at least they are always dominated by a more thorough analysis of the data. One thing I like about JMP is that you never get a test result without getting a lot more – graphical and other analysis of the data. The test result is simply one small part of the output and can easily be ignored (usually the graphical output gets one’s attention so that the tests are easily ignored).
I guess I have never experienced software as good as you are describing, so I don’t know. If it is prompting you to think, that seems good. Just taking the missing data example, will it then prompt you on a model of the missingness? I can’t imagine any tool so complex as to guide one through all the decisions…it still sounds like an automated flow chart of sorts.
This is along the lines of what I would have liked to have been taught, in this order:
1. Data visualization and familiarity, and ‘how things work’. Just an entire semester of plots of real-world data. How to visualize data. How to think about data and the processes (including all kinds of error in collection) that generate it. The ‘how things work’ part would simply show examples of how real-world phenomenon can be modeled with math equations. It wouldn’t have to be complicated, just a way to realize that things often aren’t a linear additive model (although many times that’s the best we can do). Students would just look at plots and curves. They wouldn’t work it all out. Why is it that data doesn’t exactly fit deterministic equations? Etc.
2. A large bestiary of probability distributions and how they relate to real-world phenomenon as seen in (1).
3. Simulation. How can I simulate the data that I saw in (1) using (2)? Learning how to do all kinds of simulation should come *before* regression modeling, because in simulation, you are actually learning how a model (data generating process) works. I really like Keith O’Rourke’s comments on this blog that focused so much on simulation (and of course AG has written a lot).
(Notice so far there is no ‘statistics’. It’s all generative processes and trying to recreate them.)
4. Modeling. Now that I had 1, 2, and 3 down, the actual modeling part would be way easier and make sense as to what the point is.
No flow chart would be involved, because the decisions made about modeling would come from an attempt to generate the process (even if it means a lot of linear additive simplification), instead of thinking about matching a method to the data at hand.
@jd (March 30th 11:59AM)
I would slightly diasgree with your point (2), learning ‘a large bestiary of probability distributions.’ While that’s an important thing for later, it kind of contradicts what you would learn in (1), where you talk about real world data generation processes. I guess the baseline of such a class would be, ‘There is no distribution that describes the data generation process sufficiently well in many cases (particularly in social sciences).’ [maybe I’m social science biased here, somebody corret eif I’m wrong plz] If the next thing is to learn a bunch of distributions, I’m afraid that the students who have not lesson (1) written deeply into their heart of hearts will go out and just apply ‘suitable’ distributions to cases without checking whether that is reasonable. I once made that mistake in a prediction problem. I only knew the Poisson distribution for discrete cases, so it’s gotta be a Poisson distribution, right?! The results were just terrible. And only after people reacted rather surprised at the results I realized the gravity of my error and rushed to correct it. I guess there is a lot of truth to the proverb, ‘If you have a hammer, everything’s a nail.’
I’d like to add that I like the idea of learning to simulate data early on (3). Tbh. I’m not sure I was ever taught how to simulate data generating processes beyond ‘Draw a bunch of numbers from the normal distribution!’ but had to teach it to myself. I would have liked to learn earlier about the bootstrap, which yields much better results than numbers drawn from a ‘known’ distribution in many cases.
I generally agree with the tenor of putting less emphasis on tests, as to the novice that’s basically an invitation to the initiate to abandon all reason(ing) about fundamental assumptions and go on auto pilot. That would have been me not so long ago…
I have used JMP for a long time with engineers and various types of applied scientists. It is much better a finance spreadsheet that has no true column structure or data types. And if a person is somewhat quantitative and has a basic understanding of some methods, they can get pretty far. It has improved over the years. It is also a great tool for interaction in groups. But when I have my own work I use a more flexible statistical language.
I am against the ‘zoo’ type of statistics or cookbooks. I worked for an engineer who saw statistics as a ‘bag of tools’ and would not understand the table in the tweet. But in the real world, tests are valuable. Quite often the null of 0 is realistic. For example a vendor of plastic bags or tubes no longer carries the size needed for a medical product. It would be quite a shock if the competition supplies have any impact on the final biological characteristics of the final product. So a young engineer has to go into the lab and execute a designed experiment on the new input just to make sure. A confidence interval on the mean difference goes far. Also I worked in toxicology where there is large body of knowledge, no expectation of impact, but an important surprise if there is at a high enough dose.
Regarding one-way ANOVA or Kruskal-you can frame it as a dummy-coded regression. But most of the time there is not a reference value, just a desire to identify any unexpected results between batches or other groupings.
The null of 0 is never true, outside a tiny few cases, like “what is the difference in mass between a positron and electron?”. But it’s not really that you never get exactly zero as the difference which is the big issue with frequentist testing. The real issue is that **data collection is not an IID random number generator** In real world experiments there are lots of time-varying aspects of everything. I helped someone with a bio experiment where if I remember correctly someone came and cleaned the lens of a photo-detector at some point in the experiment so data taken after that cleaning was “brighter” than data taken before. Similarly agriculture results from one year will be different from agriculture results another year because of differences in the weather. Suppliers of one set of chemicals will have a different set of contaminants than a different supplier of the same chemicals. If our analysis relies on frequency properties of random sequences (which Frequentist tests do) then we have a major problem.
As an example, take a look at MCMC output. It’s entirely common to get say 2000 draws from an MCMC simulation with effective sample size of say 180. If you were to collect 2000 data points from your population of say chemical suppliers bottles of product, and it were more like an MCMC (ie. serially correlated results) than a pure random sample (IID) then you’d say you had precision at the 1/sqrt(2000) ~ .022 level, when in fact your actual precision is 1/sqrt(180) ~ .075
But you’ve randomly subsampled from the sequence, so you won’t be able to calculate the serial correlations, they’ll just be there in the underlying process, so you can’t correct for this.
The real problem with Frequentist tests is that their assumptions are strongly violated right from the start in almost all cases, so some fraction of the time they tell you something that is totally irrelevant to your actual physical process but you don’t know when.
As another “adult learner of statistics” (I absolutely love the term), I really like the concept of this. I also get that there is more to consider, as Andrew pointed out.
I can give a giant plug for “Regression and Other Stories” – the best book I’ve ever seen on the topic. I’ve bought it for many colleagues as well.
However, as clear and useful ans RaOS is, it doesn’t spend much time on this specific issue – that all these named tests are largely just postprocessing of linear models. That is *not* a knock on RaOS. Maybe something for the next edition ;)
I believe ‘the zoo’ of stat. tests exists because the number and level of measurement of the variables at play dictate them. We cannot do a t test on two continuous variables, but we can do a regression. If both ind. and dep. var. are categorical, we are dealing with counts/percentages, not means. How would regression help there?
More importantly, I wonder why nobody mentioned research design which precedes any analysis. Regressions are (usually) performed on ‘found’ data, that just happened to be collected, without any prior research manipulation/control. OTOH, ANOVA is used in a strictly controlled experimental setting. We can argue that they are the same mathematically, but that doesn’t change anything to demonstrate causal superiority of regression. Quite the opposite, perhaps. I always thought of research/experimental designs suitable for linear regressions as sitting lower on a totem pole of causal inference. Aren’t regressions most commonly used on survey data, without any experimental manipulation, where multiple variables are collected and analyzed to see what sticks?
However, I am all in favor of reporting various effect sizes and conf./cred. intervals, rather than p values, regardless of the tests used.