Bill Behrman writes:
I commend you for providing the code used in Regression and Other Stories. In the class I’ve co-taught here at Stanford with Hadley Wickham, we’ve found that students greatly benefit from worked examples.
We’ve also found that students with no prior R or programming experience can, in a relatively short time, achieve considerable skill in manipulating data and creating data visualizations with the Tidyverse. I don’t think the students would be able to achieve the same level of proficiency if we used base R.
For this reason, as I read the book, I created a Tidyverse version of the examples.
For these examples, I tried to write model code suitable for learning how to manipulate data and create data visualizations using the Tidyverse.
For readers seeking the code for a given section of the book, I’ve provided a table of contents at the top of each example with links from book sections to the corresponding code.
I notice that the book’s website has a link to an effort to create a Python version of the examples. Perhaps the examples I’ve create can serve a resource for those seeking to learn the Tidyverse tools for R.
This is a great resource! It’s good to see this overlap of modeling and exploratory data analysis (EDA) attitudes in statistics. Traditionally the modelers don’t take graphics and communication seriously, and the EDA people disparage models. For example, the Venables and Ripley book, excellent though it was, had a flaw in that it did not seem to take modeling seriously. I appreciate the efforts of Behrman, Wickham, and others on this, and I’m sure it will help lots of students and practitioners as well.
Behrman adds:
I couldn’t agree more on the complementary roles of EDA and modeling.
For some of the tidyverse ROS examples, I added an EDA section at the top, both to illustrate how to understand the basics of a dataset and to orient readers to the data before turning to the modeling.
We’ve found that with ggplot2, students with no prior R or programing experience can become quite proficient at data visualization. When we give them increasing difficult EDA challenges, they actually enjoy becoming data detectives. Our alums doing data work in industry tell us that EDA is one of their most useful data tools.
Since ours is an introductory class, what we teach in “workflow” has modest aims, primarily to help students better organize their work. We created a function dcl::create_data_project() to automatically create a directory with subdirectories useful in almost all data projects. With two more commands, students can make this a GitHub repo.
We stress the importance of reproducibility and having all data transformations done by scripts. And to help their future selves, we show students how to use the Unix utility make to automate certain tasks.
P.S. We put their code, along with others, on the webpage for Regression and Other Stories:
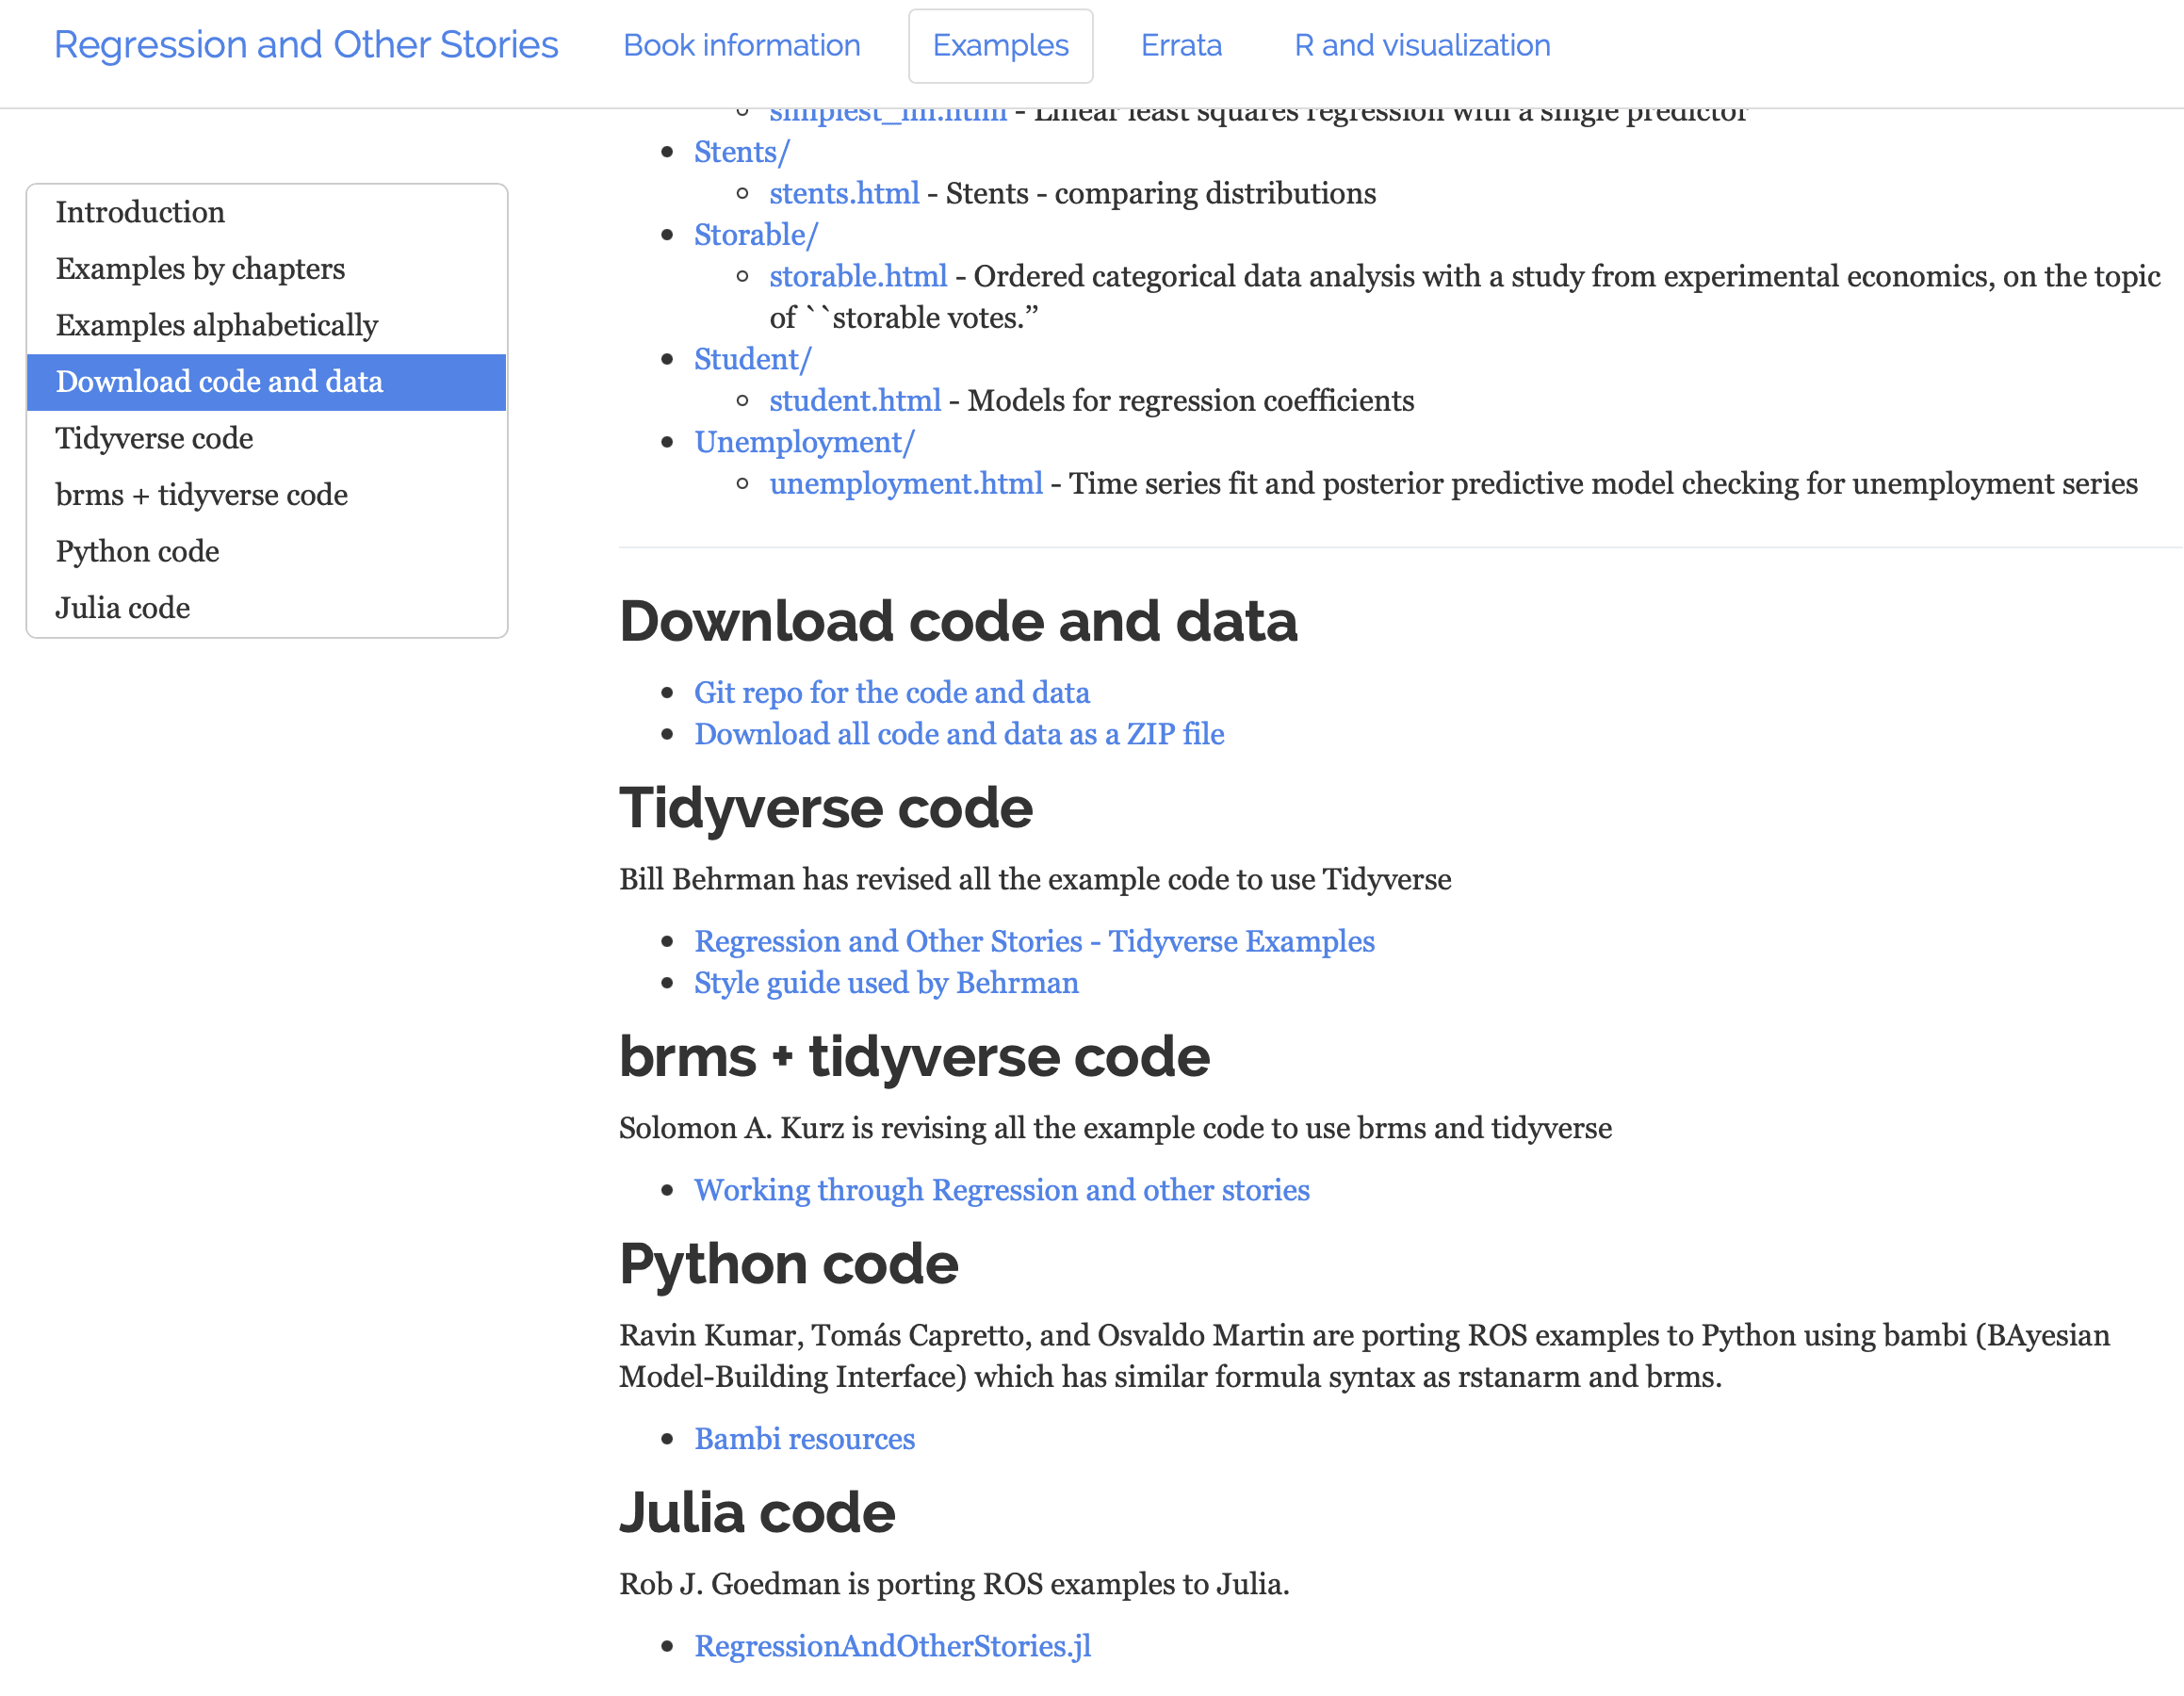
And here’s their style guide and other material they use in their data science course.
I’ve used ROS for my MA level polisci stats course. I’ve enjoyed it & have been tidying the code, once the semester is done, I’ll post it to my git!
Thanks in advance!
I just wish EDA were explicitly defined once in the post as “Exploratory Data Analysis” to make it more accessible to some readers.
Done.
> We created a function dcl::create_data_project() to automatically create a directory with subdirectories useful in almost all data projects. With two more commands, students can make this a GitHub repo.
Instead of re-inventing the wheel, you (and your students) are better off using the standard tools for these tasks. See the **usethis** package, especially `create_project()`, `use_git()`, `use_github()`, and related functions.