Palko discussed this the other day:
Oklahoma is moderately pro-choice and yet it basically photocopied the Texas law, complete with bounties.
Just to be clear: surveys find Oklahomans to be less supportive of abortion rights than the average in the U.S., but still more supportive than not. So that’s “moderately pro-choice” compared to a 50/50 baseline. According to this Pew Research summary, 51% in Oklahoma say abortion should be legal in all or most cases, 45% say illegal in all or most cases.
Palko pointed a news article with this map:

Missouri and Oklahoma stand out as the only existing states where laws have been passed making abortion illegal, despite more people supporting than opposing legal abortion.
I thought about this when picking up the newspaper today and seeing this:
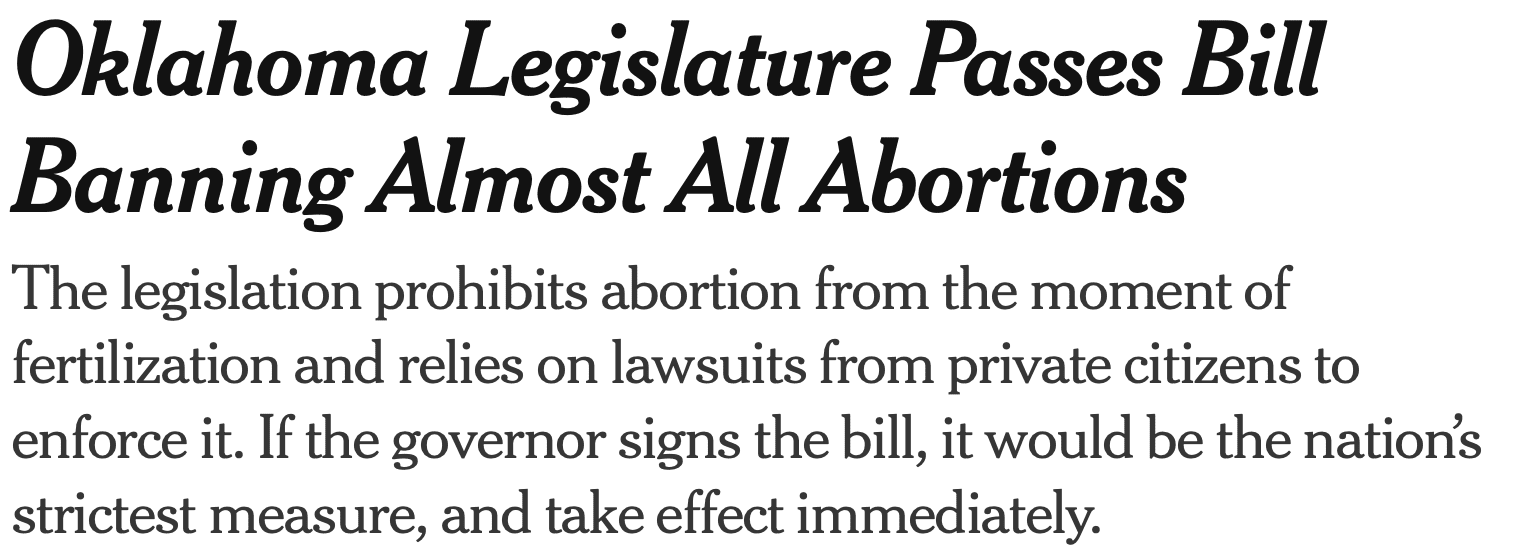
The bill “passed on a 73-16 vote,” a lopsided margin given public opinion in the state. Now, I’m not saying this 51%-45% margin is perfectly accurate—things depend a bit on how you ask the question, there’s survey nonresponse, etc., but at best for the anti-abortion side you could get something like an even split in opinion.
Here’s a quick adjustment. Trump received 67% of the two-party vote in Oklahoma in 2020 and was polling at about 62% in the state. A quick adjustment would add 5% to the Republican vote share. Abortion attitudes are moderately correlated with partisanship, so adding 5% to the Republican column might correspond to adding 2% to the anti-abortion column, which would take us from 51-45 to 49-47, then you can consider sampling error and do some MRP . . . let’s call it 48-48 in the state.
It does not defy political gravity for a legislature to vote in a way different from public opinion: issues are bundled, there’s political polarization, the whole thing is tangled up with national politics, also there’s some sort of pent-up demand from activists who can push anti-abortion legislation in a way that they could not do for fifty years. So, lots going on.
And abortion’s not the only issue where there’s a lack of congruence (as Lax and Phillips put it) between opinion and state policies. One familiar example is the death penalty, which has been popular in most states for many decades but is rarely carried out anywhere in the country.
Still, that all said . . . a 73-16 vote in the legislature is a striking deviation from a 50-50 split in the population, indicating something about how politics works in this country.
Isn’t this probably (mostly) due to republican primary voters being more anti-choice than the state as a whole?
Isn’t it obvious? It’s almost certain that most of the pro-choice population is concentrated in a few districts that are strongly pro-choice, which means the majority of state legislators are safe by voting anit-choice.
This kind of analysis is common these days but it’s really strange that it seems to baffle so many otherwise apparently intelligent people.
The county I live in determines almost every state-wide election, and much of the time candidates that win state-wide and issues that become law win in only 4-5 of the over 30 counties in my state. Maybe if you’re in the majority opinion where you happen to live, you believe so strongly in your views that it never occurs to you that, geographically, most of your state doesn’t agree with you. I’d go even further and suggest that even my county is geographically on my side – but the areas of high population density within it are against my views, and the same for adjacent counties that have large cities.
Anon:
Geographic distribution will have some effect, but it won’t get you from 50% to 82%. State legislative districts are equal in population; they don’t do it by county.
“State legislative districts are equal in population; they don’t do it by county.”
That’s irrelevant :) If some districts are strongly pro-choice, the majority of districts can still be anti-choice and their legislators could vote accordingly. You must know that because it’s the whole point of the gerrymandering that you oppose.
I’m aware voting isn’t by county. The point is still valid: the geographic distribution of opinions can be dramatically different than the population distribution. It’s a relevant point for folks complaining about democracy and representation. Geographic distribution matters since the conservative part of the country produces most of the food and raw materials and the liberal part of the country produces most of the equipment that food and raw materials are extracted with – meaning the two parts need one another, regardless of the population distribution.
Anon:
It’s not at all irrelevant that districts are equal in population. Before the 1960s, districts were far from equal in population and that did directly affect representation. Anyway, there are lots of reasons why legislators vote in a way that differs from voter preferences. We live in a representative democracy, not a direct democracy.
“It’s not at all irrelevant that districts are equal in population. Before the 1960s, ”
Are we talking about now or “before the 1960s”??? The case before 1960 is irrelevant.
Your statement:
‘The bill “passed on a 73-16 vote,” a lopsided margin given public opinion in the state.’
Is a blatant misrepresentation of the actual circumstances in Oklahoma, where the anti-choice party, the Republicans, control 80% of the seats in both houses of the state legislature. The 73-16 vote is actually surprisingly pro-choice given the composition of the legislature. It’s ***virtually certain*** that pro-choice views are highly skewed to a small number of urban legislative districts – just like party vote.
You obviously know this, which makes me wonder why you’re making such an obviously wrong claim.
Anon:
What is the “obviously wrong claim” you say I’m making? I wrote, “the bill ‘passed on a 73-16 vote,’ a lopsided margin given public opinion in the state.” This is an accurate statement, not a blatant misrepresentation at all! As I wrote in my post, there are reasons for this lopsided margin.
Andrew: 73-16 is a nonintuitively one-sided vote given the roughly 50-50 public opinion, but that’s how our political system works.
Anonymous: Nu-uh, that’s just how our political system works.
Anon, there is no disagreement here (other than your ridiculous claim that the population distribution over the legislature is somehow politically irrelevant). Broadly speaking, you’re both saying that nonrepresentative congressional votes is a natural result of the way the legislature is organized.
Anon:
To put it another way: Donald Trump received 65% of the vote in Oklahoma in 2020. An 80% Republican legislature is the kind of thing you expect when legislators are elected in single-member districts. Meanwhile, the polls find that half the people in the state say abortion should be legal in all or most cases. The result is a very large gap between voter attitudes and legislator positions. Such a gap is interesting. There are reasons for the gap. It’s not mysterious. It’s still important and worth noting.
Anon: Are you suggesting that votes should somehow be weighted by land area? I’m not sure how else I can interpret this: “I’d go even further and suggest that even my county is geographically on my side – but the areas of high population density within it are against my views”, or the phrase “geographically, most of your state doesn’t agree with you”. You might want to explain how you intended these statements.
Adding on to my earlier comment which hasn’t yet appeared:
It would be interesting to see the geographic distribution of the poll responses for Oklahoma. I wonder if it’s possible that response geographic distribution could be a significant source of error because the population distribution is likely to be skewed strongly to the city. If the survey response is also strongly skewed geographically to high population areas, then a small error – say larger non-response – in the low-population region could translate into a larger error in the overall survey.
Anon:
All things are possible, but pollsters do try their best, and in my above post I did a rough adjustment for partisanship.
Another good argument for open primaries and rank choice voting!
> Still, that all said . . . a 73-16 vote in the legislature is a striking deviation from a 50-50 split in the population, indicating something about how politics works in this country.
It’s because the pro-choice side doesn’t really care about this issue but the pro-life side does.
Intensity of political beliefs matters too, not just the raw polling data.
(There are a lot of reasons why the pro-choice side doesn’t care, but I think a lot of it can be traced down to how most pro-choice voters realize that they can just go out of state if they need to.)
Other than the tip of the panhandle, they are surrounded by Texas, Arkansas and Kansas. It’s a long drive to the nearest clinic.
Ethan –
> ,… but I think a lot of it can be traced down to how most pro-choice voters realize that they can just go out of state if they need to.)
What is your basis for that belief?
Does noone seem to think that women may go out of state, and stay there, way before they need to? If I was a young women I would be looking to get out. Even if I never intend to use abortion services, I would like to have that safety net easily available. While there are some aspects of fertility a women can control – pregnancy by rape, an incomplete miscarriage or an ectopic pregnancy aren’t some of them.
Both Oklahoma and Ohio legislatures are controlled by Republicans (according to Wikipedia). Is this just yet another example of a party pushing through its political agenda while it can? (This behaviour is not restricted to Republicans or US politicians of course).
Alternatively it suggests that allowing political parties or political appointees to determine voting district boundaries is not going to result in representative democracy. An independent commission would be much better IMHO.
However in government (as in statistics) the concept of independence is attractive and nice to have but bl**dy hard to achieve in practice.
https://www.pewresearch.org/politics/2021/06/30/validated-voters-methodology/
So 9,668/11,145 = 86.7% of pew survey responders voted in 2020. This compares to ~66% national voter turnout.
Why would you expect this obviously non-representative poll to match up with voting results, let alone how the legislatures vote?
The simplest explanation for all these discrepancies is that polling and voting are measuring much different populations.
Anon:
The people who conduct these surveys are professionals. You can feel free to disbelieve poll results that you don’t like, but I think this will just leave you in an unnecessary state of ignorance about public opinion. Regarding the overrepresentation of voters: I’d say that pollsters kinda split the difference on this one, in that they aim to match the population of adults, they know that surveys overrepresent people who are interested in politics, and for opinion questions there is generally more interest in the opinions of voters than the opinions of nonvoters. If a survey says that 51% of respondents (after adjusting for demographics) support abortion rights, that’s something between an estimate of 51% of all adults and an estimate of 51% of all voters in the state. As I wrote above, I see an argument for calling this 48-48 instead of 51-45, but it’s very very far from 18-82. In short: when thinking about politics it’s good to know about public opinion. Surveys are not perfect but I don’t think they’re terrible. And, no, I don’t expect public opinion to line up with how the legislators vote: as noted above, we have a representative democracy not a direct democracy. This produces examples of lack of congruence, and it’s interesting to see when and where this happens.
The majority of research being done is by “professionals” that put p-values everywhere, and demand everyone else does too, without knowing what they mean. Getting some kind of job/title/accreditation doesn’t mean you know what you are doing.
So while I have not looked deeply into these polls, the argument experts probably know what they are doing is not convincing.
It isn’t that I don’t like the results. In fact I am pro-choice, about pretty much everything. But when non-representative polls repeatedly disagree with reality, we should look at the polls. Instead, when they disagree with voting, you can blame the voting. But it seems strange to blame reality rather than the poll that is attempting to approximate it.
Anon:
Read my above post. I’m not “blaming” reality or “blaming” a poll. It’s a well known aspect of representative democracy that there can be differences between policy and public opinion. Given the general success of election polls (not as good as random samples from an urn but usually within 5 percentage points), I think it would ridiculous to try to interpret the difference between 45% and 82% as polling error. Polls are imperfect but not that imperfect.
But, if you used the same population to predict the voter turnout next election you would guess ~85%, when actually it was 66%. That was the first thing I thought to look for as a “sanity check”.
So I don’t see why 20% deviations from polls should be surprising. On the other hand, my understanding is a race isn’t typically going to be funded without some poll showing that winning is at least near the limits of some margin of error. So if that is ~5%, you would expect most election results to be in that range regardless of the accuracy of the polls in measuring public opinion.
Anyway, the way to distinguish between polling error and differences between policy and public opinion is to model it and make predictions based off the poll results. An experimentum crucis, if you will.
Anon:
Please read my above comment: “Regarding the overrepresentation of voters: I’d say that pollsters kinda split the difference on this one, in that they aim to match the population of adults, they know that surveys overrepresent people who are interested in politics, and for opinion questions there is generally more interest in the opinions of voters than the opinions of nonvoters. If a survey says that 51% of respondents (after adjusting for demographics) support abortion rights, that’s something between an estimate of 51% of all adults and an estimate of 51% of all voters in the state. As I wrote above, I see an argument for calling this 48-48 instead of 51-45, but it’s very very far from 18-82.”
More generally, we and others have looked at polling errors in elections, including close elections and non-close elections, and you just about never see anything like a 20 percentage point error. Your reasoning in your second paragraph is incorrect.
I saw this, but (regardless of whether this is a good idea) how exactly are they going about “splitting the difference”?
The link above leads to here for further methodological details: https://www.pewresearch.org/politics/2020/11/20/post-election-views-methodology/
They appear to have attempted random samples (via either phone calls or mailing addresses, depending on the year), and got ~5% cumulative response rate.
I also see that 6,185/10,399 = 59.5% of voters were for Biden vs 3,829/10,399 = 36.8% for Trump. Then they actually used “2020 popular vote turnout and margin” to adjust the results.
They should be showing that this weighted/adjusted model has some kind of predictive skill, not using the outcome to adjust it.