First the story, then the background, then my final thoughts.
1. The story
Valerie Bradley writes:
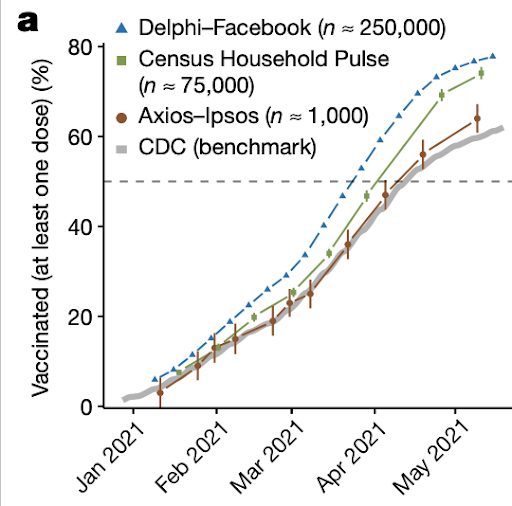
Our (me, Shiro Kuriwaki, Michael Isakov, Dino Sejdinovic, Xiao-Li Meng, Seth Flaxman) recent article in Nature shows that two large online surveys of US adults consistently overestimated first-dose COVID-19 vaccine uptake relative to counts released by the CDC throughout the spring of 2021. By May 2021, Delphi-Facebook’s COVID-19 Trends and Impact Survey (collecting about 250,000 responses per week) and the Census Bureau’s Household Pulse Survey (about 75,000 responses every 2 weeks) overestimated first dose uptake by 17 percentage points (14–20 with 5% benchmark imprecision) and 14 pp (11–17 with 5% benchmark imprecision), respectively, relative to the CDC’s historically-adjusted estimates released May 26, 2021. These errors are orders of magnitude larger than the uncertainty intervals reported by each survey, which are miniscule due to the large sample sizes. Meanwhile, a more traditional survey run by Axios-Ipsos, with only about 1000 responses per week, provides more reliable estimates with reasonable uncertainty. We use Xiao-Li’s framework to decompose the error in each survey and show how a survey of 250,000 respondents can produce an estimate of the population mean that is no more accurate than an estimate from a simple random sample of size 10. Our central message is that data quality matters more than data quantity, and that compensating the former with the latter is a mathematically provable losing proposition.
We’ve gotten some great feedback since publication, which we thought would be useful to discuss more broadly:
1. Is this actually a paradox?
This question was raised by Andrew, who wrote:
“The only thing I don’t really understand about this particular article is why they talk about a ‘Big Data Paradox.’ I agree with their message “that data quality matters more than data quantity,” but I don’t see this as a paradox. Maybe the paradox is in the way that surveys are reported? They say that increasing data size ‘magnifies the effect of survey bias’” but that seems to miss the point: increasing data size does not, in and of itself, increase bias. For example, if the two surveys they are criticizing (Delphi and Household Pulse) were smaller, they’d still be just as biased, right? So I don’t get it when they say ‘small biases are compounded as sample size increases.’ I’d think it would be more accurate to say that biases persist even as sample size increases, not that they are compounded.”
Shiro wrote back:
“‘biases persist even as sample size increases’ is exactly right. We’d say it’s also compounded in the sense that it becomes a larger portion of the total error — technically, the Mean Square Error (MSE, Bias^2 +Variance). MSE is also the metric by which we quantify “accurate” in the abstract when we write ‘[unrepresentative large surveys] are no more accurate than … [a SRS of size 10] for estimating a population mean.’”
Xiao-Li, who wrote the original 2018 paper on the Big Data Paradox, added,
“I used the term “paradox” in the same way as in “Simpson’s paradox”, which, as you know, is not a mathematical paradox at all, but rather people’s misperceptions from comparing apples with oranges created by confounding factors. The “Big Data Paradox” refers to the phenomenon that the larger the size, the smaller the error bar according to the traditional calculations, but when the answers are biased, such diminishing error bars would increasingly mislead us. In this sense, it appears to many as paradoxical, since the more data, the more we get misled. But as you know, this is all due to the incorrect calculation of the error bars, which should be the total error, not just the sampling error.”
As one intuition for this paradox it’s easy to convince oneself of the following. A 99% sample of the population will produce estimates with almost no error, even if the sampling was somewhat biased; therefore if one can collect Big Data that approaches that 99% sample of the population, estimates based on that sample should become increasingly correct. However, despite this intuition, overcoming even small bias in data collection is incredibly difficult with Big-but-not-99% data. Meng (2018) describes this using the Law of Large Populations (as opposed to the Law of Large Numbers): the theoretical result that the error of the estimate increases asymptotically with population size N, all else fixed.
2. The CDC data isn’t perfect – how does this affect the results?
Great point. The potential for non-sampling error in the CDC benchmark is why we have included +/-5% and +/-10% “Benchmark Imprecision Intervals” in our analysis. The 5% and 10% intervals stem from our analysis (ED Figure 3 in the article) of changes in the CDC’s estimates of first dose uptake as reports are updated to account for reporting delays. These delays have already been accounted for in the CDC data we use, so the benchmark imprecision intervals allow for additional non-sampling error that is yet undiscovered. There have been reports that the CDC may overcount first-dose vaccine uptake, which would affect our analysis, but it would make Census Household Pulse and Delphi-Facebook error larger than what we have estimated.
3. Delphi-Facebook wasn’t designed to estimate vaccine uptake at a particular point in time (we have the CDC for that!), but rather to measure changes over time in other COVID-related outcomes, so how much does this analysis affect those primary outcomes?
It is certainly that Census Household Pulse and Delphi-Facebook were not designed to measure snapshots of COVID vaccine uptake, but rather to collect data to perform fine-grained spatiotemporal analysis of COVID-like symptoms and other outcomes.
However, we address the implications of our analysis on these other outcomes in the following portion of the “Addressing Common Misperceptions” section of our article:
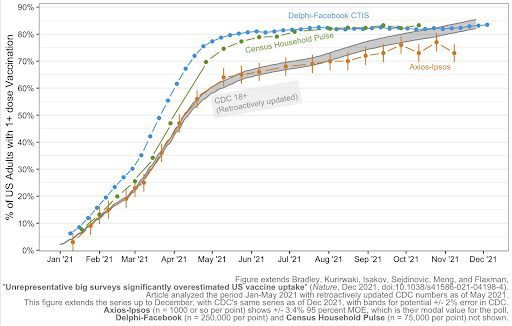
“One might hope that surveys biased on vaccine uptake are not biased on other outcomes, for which there may not be benchmarks to reveal their biases. However, the absence of evidence of bias for the remaining outcomes is not evidence of its absence. In fact, mathematically, when a survey is found to be biased with respect to one variable, it implies that the entire survey fails to be statistically representative.”Furthermore, unfortunately neither Delphi-Facebook nor Census Household Pulse actually accurately track changes in COVID vaccination status over time. The plot below extends our analysis to December and shows how first-dose uptake estimated by the two surveys plateaus in late July 2021, while CDC estimates keep increasing. According to Delphi-Facebook and CHP, no US adults have gotten first doses since late summer.
One may look at the plot above and infer that Delphi-Facebook and Census Household Pulse estimates are improving, since they overlap with CDC counts in late November 2021. However, as Xiao-Li writes, this “is an illusion since any two lines will cross somewhere as long as they are not in parallel.” In other words, we know from the demographic distributions of respondents and the rate of change of vaccination status during this period that the respondent populations of Census Household Pulse and Delphi-Facebook are different from that of US adults. It may be true that by late November 2021, the population of respondents happened to have the same vaccination rate as that of US adults, but that coincidence does not prove the reliability of the surveys.
This does not mean that CHP and Delphi-Facebook are not still useful sources of information about COVID. However, we will reiterate our words of caution that given that we know the surveys are not statistically representative, researchers using the data should make an effort to justify why it is still useful for their analysis, or how they have accounted for the bias. A great example of this can be found in Lessler et al. (2021) which cites a technical report from Lupton-Smith et al. (2021) validating the Delphi-Facebook survey for their particular use case (in-person schooling).
Speaking generally, one of the core problems of statistics is generalizing from available data to the population of interest. I still don’t really get the whole “big data paradox” thing, but I agree that there’s no reason to think that a sample, just because it’s large, will be representative of the population of interest. Indeed, there can be more than one population of interest, and a sample can’t really be representative of more than one population! As statisticians, we should probably be spending less time thinking about drawing balls from urns and more time thinking about how our samples differ from the populations we’re interested in.
2. The background
Last week a journalist sent me an email:
I am writing about this new paper in Nature [by Valerie Bradley et al.] that criticizes the methodology of Covid surveys by Census and Delphi/Facebook.
One of the authors, Seth Flaxman, pointed me to something you wrote about the Household Pulse Survey.
It turned out that I’ve collaborated with several of the authors of this new paper, and I responded as follows:
The article looks reasonable to me. I know three of the authors and am ccing them in case they have additional thoughts.
The basic claim—that the traditional survey with adjustments obtained a more representative sample than the two other surveys—is plausible, and I agree with their focus on total survey error as being more important that narrow measures of sampling error. My colleagues and I have found the same thing in political polls. Total survey error has been discussed for a long time in the survey sampling world, and it’s certainly an idea that’s well understood by the Census. However, as Bradley et al. discussed, in practice people often forget about nonsampling error (and that came un in that blog discussion you linked to also).
The only thing I don’t really understand about this particular article is why they talk about a “Big Data Paradox.” I agree with their message “that data quality matters more than data quantity,” but I don’t see this as a paradox. Maybe the paradox is in the way that surveys are reported? They say that increasing data size “magnifies the effect of survey bias,” but that seems to miss the point: increasing data size does not, in and of itself, increase bias. For example, if the two surveys they are criticizing (Delphi and Household Pulse) were smaller, they’d still be just as biased, right? So I don’t get it when they say “small biases are compounded as sample size increases.” I’d think it would be more accurate to say that biases persist even as sample size increases, not that they are compounded.
But I guess this doesn’t affect their main point, which is that those two particular surveys had problems.
The authors of the article had more to say, and this blog seemed like a good place for the discussion. There’s more space on a blog than in the newspaper.
3. My final thoughts
Getting back to the big data paradox, I guess I’d say two things:
1. Big data are typically messy data, available data not random samples. So I agree that, in practice, bias can be a bigger problem with big data than with traditional surveys. Then again, small data can be really biased too, and some prominent researchers don’t see the problem at all. So maybe safest to just say that we should always be concerned with discrepancies between sample and population, whatever the sample size.
2. Remember the most important formula in statistics. Larger sample size corresponds to smaller sampling variance, so that bias becomes more important. In the surveys discussed by Bradley et al., though, all the sample sizes were large, and really all that mattered in any of them were nonsampling error. Which is consistent with their message not to simply use sample size as a measure of survey quality.
P.S. Keith puts it well in comments:
With a moderate amount of bias confidence interval coverage will decrease with increasing sample size.
There was some early paper by WG Cochran in which he said something like the only thing that saves you in an observational study is a small sample size. Whenever I mentioned that to others they seemed puzzled/surprised. Later in my intro stats courses at Duke (2007/8) I made up some examples and assignments to convince the students that with a moderate amount of bias confidence interval coverage would decrease with increasing sample size. Took about three lectures to sink in for most and I think they got it – but they were annoyed. I guess it was like learning about Santa Clause.
Anyway, in the literature the arguments about combining unbiased studies with biased studies (strictly speaking less biased with more biased studies) in meta-analysis raged for years and maybe are still ongoing.
Observational (now called “real world”) data is ok for checking predictions, like how it has been used in astronomy.
For anything else it is like finding and interpreting bible quotes.
Keith, could you elaborator more on the “confidence interval coverage” example?
I am sure the reason has occurred to you since you commented, but the obvious is not as obvious as it obviously should be, obviously ;-)
Do a simulation of an example with a moderate bias with increasing sample sizes an calibrate the the standard SE confidence interval coverages (the +/- 2 SE that can cover the bias gets so small it rarely does).
I see, so in this example there is no “learning” with more observed data.
I think we would like to distinguish between (a) “bias in observations” and (b) “bias in estimates”, both of which can lead to a bias in the observation-population extrapolation, but in different manners. A bigger sample size helps (b), but does nothing for (a).
In the previous comment I was thinking about (b) because interval calibration and likelihood-based inference are fundamentally two different goals. So there must plenty of examples in which a data-(over)-fitting method can have a poorer coverage/calibration with bigger sample size.
OK, for (b) there is classic Neyman-Scott problems where tiny biases in small samples combine to very large bias with increasing sample sizes (where the number of nuisance parameters increases with sample size)*.
For (a) often there is no information about the bias within the study no way to learn about and correct for it – multiple bias analysis arose out of that using informative priors for the bias.
* “Neyman-Scott problems create major challenges for likelihood methods and any visualization based on them. On the other hand, Neyman-Scott situations can be thought of arising from the lack
of replication, in the sense that there is little (or no good) replication of the incidental parameters (i.e. not many observations for each parameter common to those observations). Perhaps the most
widely known example is pair matched binary outcomes, with usual logistic regression” https://statmodeling.stat.columbia.edu/wp-content/uploads/2011/05/plot13.pdf
The Neyman-Scott example is a cool counterpart: the bias of the parameter is a constant as the sample size goes up, while the the interval coverage of data still improves with increasing sample size.
Nice quote from Stephen Senn re combining unbiased studies with biased studies “Methods that try to leverage observational studies by assuming that they should be similar to an RCT are making a strong implausible assumption that is not even made when moving from one RCT to another.” https://www.linkedin.com/pulse/studying-effects-studies-stephen-senn/
As cosmologist Alain Blanchard once put it, when it comes to trusting a measurement, “It’s the systematics, stupid”.
Nice, Andrew. It is really a sad commentary that many professional “data dredgers” don’t understand this issue. Unfortunately, similar important issues seem to be ignored my the ML community in general. Somehow, there is this belief that the larger pile of data one has available. the better the results, regardless of data quality, and that the data will “speak” to the analyst. Sampling issues don’t seem to be of much concern. Simply consider the data quality associated with the current almost ubiquitous practice of requesting customer evaluations of service quality associated with telephone and online customer service contacts. Junk is junk, no matter how much junk one has.
The key to ML is getting a representative hold-out dataset to check the accuracy at the end. For training you want to include as many features correlated to your outcome as possible.
You are correct, but lousy data collection/measurement procedures still produce data with non-sampling related biases — selection bias, etc — even though a hold-out data set is used for validation of a “training” set. Both the “training” set and the “hold-out” set are likely to exhibit the same non-sampling bias.
Ideally you get your holdout from data generated after the model was developed, you can’t do much better than that.
But in the end ML is just inductive reasoning, if some fundamental circumstances change (eg, for netflix people infamously switched to online rather than ordering dvds) then your model isn’t going to work anymore.
That is why science works better than inductive reasoning. Ie, guessing at explanations for what you observe, then deducing predictions from those explanations (essentially a set of assumptions), and comparing to new data.
> That is why science works better than inductive reasoning.
I agree, but we can’t prove that?
You “prove” it the same way people have been proving things for thousands of years. By making surprising predictions that come true (eg, Haley’s comet) and performing impressive feats (eg, Archimedes pulling a ship out of the harbor).
Again I agree but this is not a proof but just repeatedly observed empirical successes for some reference set.
Are you asking for some kind of formal logical proof?
In science there is no proving or disproving.
Where T = theory, A = auxiliary assumptions (equipment functioning properly, etc), and O = observations
You deduce:
If (T & A) then O
If we observe O, that is affirming the consequent. There could be other theories also consistent with O.
If we observe not O, then the conjunction is negated:
!O -> !T or !A or (!T and !A)
But we can never tell whether it was the theory, any of the many auxiliary assumptions being made, or some combination that is incorrect.
In ML you can often artificially increase data quality synthetically (i.e. data augmentation), since you’re trying to solve an ‘abstract task’ rather than unwind an explanation of a fixed set of source data. Seen in that light data quality is taken seriously; it just isn’t as strongly determined by the quality of the original source. You can often boostrap a good dataset from a bad one in ways that wouldn’t make any sense in a survey setting.
That said there are of course areas where the right augmentations are hard to find, e.g. with transferring medical scans between hospitals. And people have consistently found that the amount of mislabelling on common datasets like ImageNet has an effect on performance. Data quality is still relevant, it’s just less of a determining factor.
Yup – https://statmodeling.stat.columbia.edu/2019/12/02/a-bayesian-view-of-data-augmentation/
> As statisticians, we should [spend] … more time thinking about how our samples differ from the populations we’re interested in.
This is the correct take. Clearly a random sample of FB users, implicitly weighted by their usage of FB and restricted to those who click on FB ads, is not representative of the general population. The abstract suggests FB used some proprietary tool to re-weight responses based on demographics … hard to say more without specifics but it’s unsurprising this doesn’t successfully control for bias.
Amusingly, a FB tool based on user’s data applied to model the distribution of non-users feels like a meta version of the original generalization problem.
Anoneuoid —
I don’t disagree with your comments. but let’s not get too far away from the belief held by many “data science” practitioners: a huge amount of data fixes all sorts of sampling and non-sampling problems and that all one needs to do is tricky “data snooping” conditional on the collected data, without taking into account the sampling bias that precludes inference to a target population. The consumer service evaluation surveys are good examples of sample selection bias, since it is likely that primarily it is individuals with strongly negative/positive views of their service contact that participate. Even in this blog, I rarely see contributors expressing much concern about these sorts of problems.
Yep. “Data science practitioners” will generate all sorts of sophisticated looking nonsense that wastes your time and money unless you make them test their models by predicting the future. And even then it is not a sure case.
I’m still puzzled by what the Big Data Paradox is supposed to be. Suppose we have a sample of 10,000 and a sample of 100,000 out of 10 million both biased samples. Neither sample has much sampling error. so their confidence intervals are very small, and you’d be equally misled in both if you know statistics. On the other hand, if you don’t know know statistics, you’d think the 100,000 sample was a lot better. Is that (a) the Big Data Paradox?
Or is it that if you have a highly biased samples of 10 and 10,000, that (b) you know your results are unreliable in the sample of 10, but you don’t know it in the sample of 10,000, if you calculate the confidence intervals?
I think it’s the second case, (b) where with a small sample you at least calculate big error bars, and a small sample the error bars are totally misleading since they don’t include the bias.
whoops, it should say “a *large* sample the error bars are totally misleading”
I think Keith said it above, quoting Cochrane. In a small biased sample, you have some coverage probability based on the fact that the variance is so much larger than the bias. (It is not the advertised probability, because of the bias, but it can be pretty close if the bias isn’t too large.) As the sample size increases, though, the coverage probability shrinks to zero in the limit.
For both Jonathan and Daniel. Calculated “error bars” or confidence intervals have nothing to do with the issue at hand. The problem is that, small or large sample size, the sample on which they have been calculated is non-representative and likely biased for the purpose of making inferences to the target population.
Not sure exactly what you’re saying here. You can make inferences with biased samples. I can figure out that I’m overweight even if my scale is always two pounds too high.
The paradox cited here is simply that with larger sample sizes, the bias is all you have left, whereas with small sample sizes you have both the variance and the bias, which increases the probability that your confidence interval covers the true value. In other words, a noisy estimate of the wrong number is almost surely better than a precise estimate of the wrong number, if you don’t have any clue how wrong the number is.
Jonathan, I think you should have a look at the sample selection literature. Heckman really laid the foundation for this literature, where, for example , one is interested in estimating the coefficients in the regression model y=x’b+e, but only has observations on y for the sample that was selected according, say, to a probit or logistic sampling rule that selection= I(w’g> 0), where z*=w’g+u. Since y is only observed if selection=1, this leads to the conditional mean of y for the selected observations:
E[y|y is selected]=E[y|x,z*>0]
=x’b+E[e|w’g+u>0]
=x’b+E[e|u>-w’g]
Without going into detail, if e and u are correlated, this implies that simple linear regression of observed y on x leads to a biased, inconsistent estimate of b. Special methods are needed to deal with this problem. (This particular presentation of the issue is stolen from Bill Greene’s Econometric text).
Jonathan, your example of a fixed bias in a measuring device such as a weight scale does not apply here.
I know the sample selection literature… (I helped Bill Greene with the beta versions of LIMDEP.) Sure, there are often methods for correcting for sample selection bias. But one of us is missing the point of this paradox, and I don’t think it’s me… Imagine you can’t correct the sample selection bias, for example. Nothing about this paradox changes at all.
What is the “paradox”? Why would one expect a larger sample size to deal with the problem. The estimate of the parameters are themselves biased. How does a 2-sided “error bar:” or confidence interval centered at a biased estimate help?
@Jonathan and Richard:
It’s only a “Paradox” because the vast majority of consumers of statistical output think the error bars represent the range over which the real value should lie.
When someone says “I have a big sample, I expect that the population average is 128 +- 2 they think it would be paradoxical to discover that the real average is 62 and the difference is because the sample is highly biased. If on the other hand someone says they have 4 samples and on that basis they think it’s 128 +- 100 then when you say later that the real value is 62 no one will be shocked.
Daniel, I don’t think that situation is a paradox. Those confused by this are just plain wrong and don’t understand what their estimates and/or intervals represent.
Exactly, that’s why I put “Paradox” in scare quotes. There’s nothing mathematically paradoxical here, it’s just misunderstanding, but misunderstanding by people who believe that they do understand something leads to perception of a Paradox.
Daniel —
Perfectly stated.
Eric: I’d say both your examples would be covered. One might hope (in the spirit of “Paradise” of Big Data in Meng 2018 AOAS) that n = 10,000 is better than n = 10, and n = 100,000 is better than n = 10,000. For a fixed sampling mechanism, that is true. But one might further reach and hope that Total Error will drop at rate 1/sqrt(n), the simple random sample rate.
In the original Meng article, “the phrase Big Data refers to those big datasets with an uncontrolled (or unknown) [response] – mechanism.” Without probabilistic sampling, which in my view is pretty much all real world surveys, we no longer enjoy the asymptotic rate of 1/sqrt(n), so our hope fails.
As Meng 2018 and others here have noted, The Big Data Paradox is like the Simpson’s paradox in that they are “statistical phenomena are not paradoxes in mathematical or philosophical senses, … but they appear to be paradoxical because of our mis-formed or mis-informed intuitions.” So in our article we clarify it by referring to the BDP as “’the bigger the data, the surer we fool ourselves’ when we fail to account for bias in data collection.”
* 1/n for Total Error (Mean Square Error), 1/sqrt(n) for RMSE.
The goal of the Delphi study was to provide better prediction of covid outbreaks, and it can easily happen that a biased predictor may improve the accuracy of the prediction.
Hal:
Ideally it should be possible to get the best of both worlds, using data from representative samples to correct for the bias of the large nonrepresentative survey while still getting the benefits of the granularity of the big data.
Regarding your first point: “we should always be concerned with discrepancies between sample and population, whatever the sample size”, this reminds me of another paradox that Alan Stuart wrote in his 1984 book “The ideas of sampling”:
“The central paradox of sampling is that it is impossible to know, from the examination of a sample, whether or not it is a ‘good’ sample in the sense of being free from selection bias (just as one cannot deduce a witness’s credentials from how he looks). Of course, if we know some details of the population, we can compare the sample to the population in respect to these details; but we can never know everything about the population (and in any case, if we could we should have no reason for sampling it).”
I believe when you refer to discrepancies between sample and population, you are probably referring to certain auxiliary variables that we know from the population, since as Stuart pointed out, if we knew everything about the population (or at least the variables we are interested about), we wouldn’t need to select a sample to begin with. I think the issue here is that unless there is a moderate to strong relationship between these observed auxiliary variables and the study outcomes, there is not much of a point in being concerned about discrepancies between sample and population with respect to those variables — your particular sample realization may very well be one in which its estimates are quite far off from the population parameters. And we know that in social surveys, we usually don’t have very strong correlates of the study outcomes.
For this (and other) reasons, I have a pet peeve with terms such as “representative samples”. It is not a term well defined in the sampling literature, it is very ambiguous, as Kruskall and Mosteller demonstrated in their series of papers in the late 70’s early 80’s, and (in my opinion) it leads the average-person to a misunderstanding about how sampling works, that we can certify whether a sample is “good” or not, and it is just an easy shortcut to legitimize any sample without some critical thinking about how it was collected. But anyhow, interested to hear what you and other think about this.
Raphael:
I do find the concept of “representative sample” to be useful; see for example here. I agree that the concept of representativeness is not clearly defined, for two reasons:
1. “Representative” is defined relative to some variables of interest. For example, if I take an approximate 1/10 sample of Americans by choosing those whose Social Security Number ends in 4, this will be unrepresentative of the population with respect to the last digit of the Social Security Number but will, I’m pretty sure, be representative on just about every other dimension.
2. There’s no sharp distinction between “representative” and “nonrepresentative.” Just about no real-world sample will be exactly representative on any dimension. For example, if you have a population of 1319 people, then a sample of size 100 can’t be representative of any nontrivial aspect of the population, because 1319 is prime, so your population can’t be 52% female or anything else that’s an exact percentage.
That said, I think you’re overstating things in your argument. First, although you can’t ever be sure that a sample is representative (or close to representative) from the sample and the population themselves, you can sometimes be sure that it’s non-representative. Indeed, much of our work in survey adjustment involves correcting for known differences between sample and population. Second, in real life we typically don’t have probability samples. So representativeness is all we’ve got.
I agree with you that representativeness with respect to auxiliary variables is relevant to the extent that these auxiliary variables are statistically dependent with outcomes that we care about. One advantage of model-based adjustment is that we can embody this concern in our statistical procedures, as discussed here.
Thank you for sharing your thoughts on this!
I hadn’t seen that first post you mentioned before, it is quite interesting. But, correct me if I’m wrong, it seems to me that is more about at which conditions it does not really matter how the sample was selected (or, more generally speaking, to incorporate other errors of non-observation, whether there are any concerns about non-ignorable missing) than the usefulness of a concept such as ” representative sample” or ” representativeness”.
Given that you believe such concept can be useful, I’d be curious to know how you would define it and what you would recommend to do in practice in order to achieve something like a “representative sample” under that definition.
This concept can be nicely explained when teaching the various bucket list of biases, such as non-response bias, age bias and so on. Non-response bias can be described as the sample excluding non-responders while the population one is generalizing to includes non-responders, therefore we have an exact description of the difference between the sample and the population. This case is absolute since non-responders are totally absent from the sample. Age bias, on the other hand, is sometimes absolute – say in the early phase of vaccine rollout when only older age groups are eligible, but more often relative. So a youth bias can be described as the sample under-representing older people (and over-representing younger people) relative to the population that one is generalizing the data to.
This situation reminds me of the infamous Google Flu Trends from years ago, another example of huge biased observational datasets failing to predict a CDC reference.
Indeed. We invoke it in our conclusion:
This is not the first time that the Big Data Paradox has appeared: Google Trends predicted more than twice the number of influenza-like illnesses than the CDC in February 2013. This analysis demonstrates that the Big Data Paradox applies not only to organically collected Big Data, like Google Trends, but also to surveys. Delphi–Facebook is “the largest public health survey ever conducted in the United States”. The Census Household Pulse is conducted in collaboration between the US Census Bureau and eleven statistical government partners, all with enormous resources and survey expertise. Both studies take steps to mitigate selection bias, but substantially overestimate vaccine uptake.