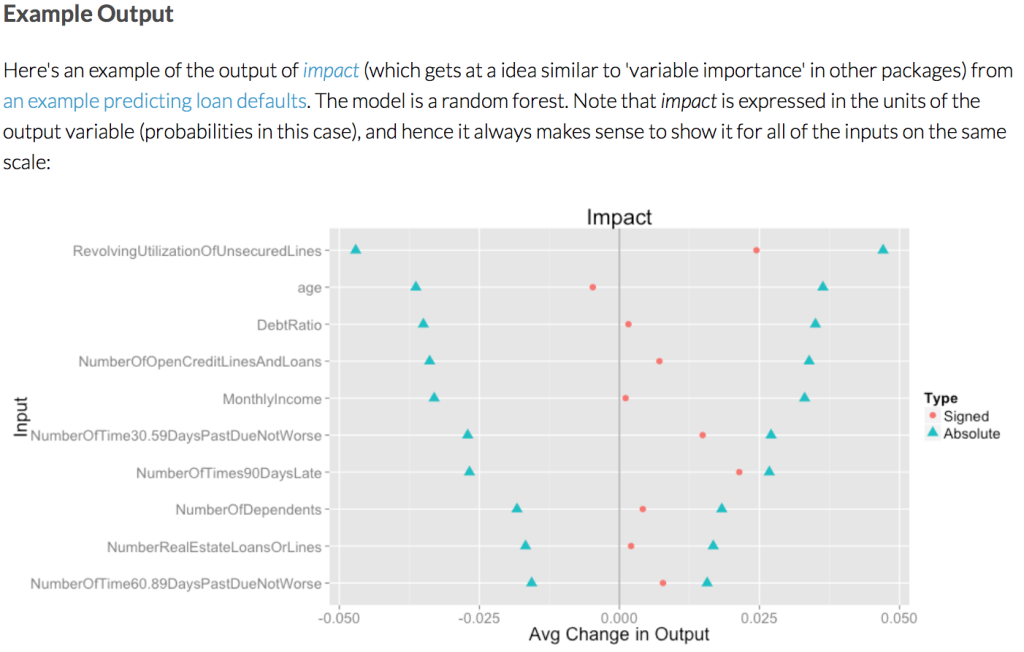
Here it is:
An R Package for Understanding Arbitrary Complex Models
As complex models become widely used, it’s more important than ever to have ways of understanding them. Even when a model is built primarily for prediction (rather than primarily as an aid to understanding), we still need to know what it’s telling us. For each input to the model, we should be able to answer questions like these:
On average, much does the output increase per unit increase in input?
How does the influence of the input vary? (Across its range? In combination with other inputs?)
How much difference does variation in this input make to the predictions? (Relative to other inputs?)
For example, if our model were a linear regression with no interactions and no transformations of the inputs, the (1) would be answered by our regression coefficients, (2) would be answered “It doesn’t vary”, and (3) would be a little harder but not too bad. All of these questions are much harder for more complicated models.This R package is a collection of tools that are meant to help answer these questions for arbitrary complicated models. One advantage of the fact that they work work equally well for any model is that they can be used to compare models.
The key feature of the approach here is that we try to properly account for relationships between the various inputs.
Chudzicki provides some more context in an email:
There’s a demonstration of the package in a logistic regression example with simulated data that’s simple enough to understand everything going on, and in another example with a real data set where the model used is a random forest.
I haven’t solved any of the open issues about the level of smoothing etc. so the user still needs to think about that, unfortunately. Maybe using something like BART to sample from u|v will be a good way around that later.
I’m very interested in working with users and possible collaborators to make the package do what they need.
I haven’t tried out Chudzicki’s package but I love the underlying idea, and I think this sort of implementation is important, for two reasons:
1. Once it’s out there, people can use it in applied work. And once a method gets used for real, we learn a lot more about it.
2. As Chudzicki discusses, the method of average predictive comparisons is not fully specified. There are some loose ends. Writing a program puts one face to face with such problems, as they have to be confronted in some way. In an article you can just B.S. your way thorough, but a computer program is more rigorous. You have to make the decisions.
+1 to point (2) above. It’s why I finally learned stats from Gelman and Hill — it grounded out in programs that (mostly) worked. One of the big problems I still have in reading applied stats papers is that so many alternatives are specified that I rarely feel confident that I can put a model together based on just a paper.
Thanks Andrew!
If anyone reading this is able to provide some advice, I’d love to have suggestions for how to deal with unordered categorical inputs in v. (The paper makes some suggestions for when u is an unordered categorical input, and the package already implements something very similar to that — but I don’t think there’s a suggestion for handling unordered categorical inputs in v.)
With enough data & few enough categorical inputs with few enough levels, you might get away with assigning weight 0 to everything that doesn’t share those input values *exactly*, and proceeding with weights based on distance in the other v’s.
Another approach would be coding the categorical inputs with indicator variables, and using those in the computation of distance-based weights.
A very different idea is to explicitly build a model for p(u|v), e.g. using something like BART. As I mentioned in the e-mail to Andrew, that could also make other things work better and help minimize the number of loose ends the user needs to think about, as long as the model works well enough without too much human attention. But this would probably be very computationally expensive.
Thoughts?
Excellent graphic! A couple of clarifying questions since RFs can be tricky. Are we to assume that the “absolute” blue triangles are expressing a confidence interval or, maybe, something like a 2 std dev range around the “signed” dots? If not, what is being presented? Also, I wasn’t aware that signs existed in RFs. How were they created?
It’s not anything like a confidence interval. Uncertainty in the model isn’t captured at all in the package right now, although that is discussed in the paper and is a very natural extension.
Let me know how you think the explanations should be improved:
http://www.davidchudzicki.com/predcomps/apc.html
http://www.davidchudzicki.com/predcomps/impact.html
I admit that the way the absolute versions are plotted right now could be a bit confusing. I should work on that. But it’s just an absolute version of the APC (or the variation I’m tentatively calling “impact”), plotted as +/- the value.
Forgive me if I missed it, but what is the package called and where is it available?
Thanks.
There’s a link at the start of the post (after the image); it’s called predcomps.
Thanks Popeye.
Note that it’s not available on CRAN. I expect that it might change a lot in the next few months, so I’m waiting until it settles down a bit to do that. I’ve heard CRAN isn’t great for quick iteration.
You’re my hero. I’ve been trying to do something like this on my own for weeks! Thank you!
Pingback: Somewhere else, part 144 | Freakonometrics
I am currently using your package to explore the positive and negatively impacting variables. If the signed value is negative, I use the variables to define the risk factor. Am I am using the Impact.signed value to interpret the risk factors in the right way..
When is your package expected in CRAN