Following up on my regression-discontinuity post from the other day, Brad DeLong writes:
The feel (and I could well be wrong) as that at some point somebody said: “This is very important, but it won’t get published without a statistically significant headline finding. Torture the data via specification search until we find a statistically significant effect so that this can get published!”
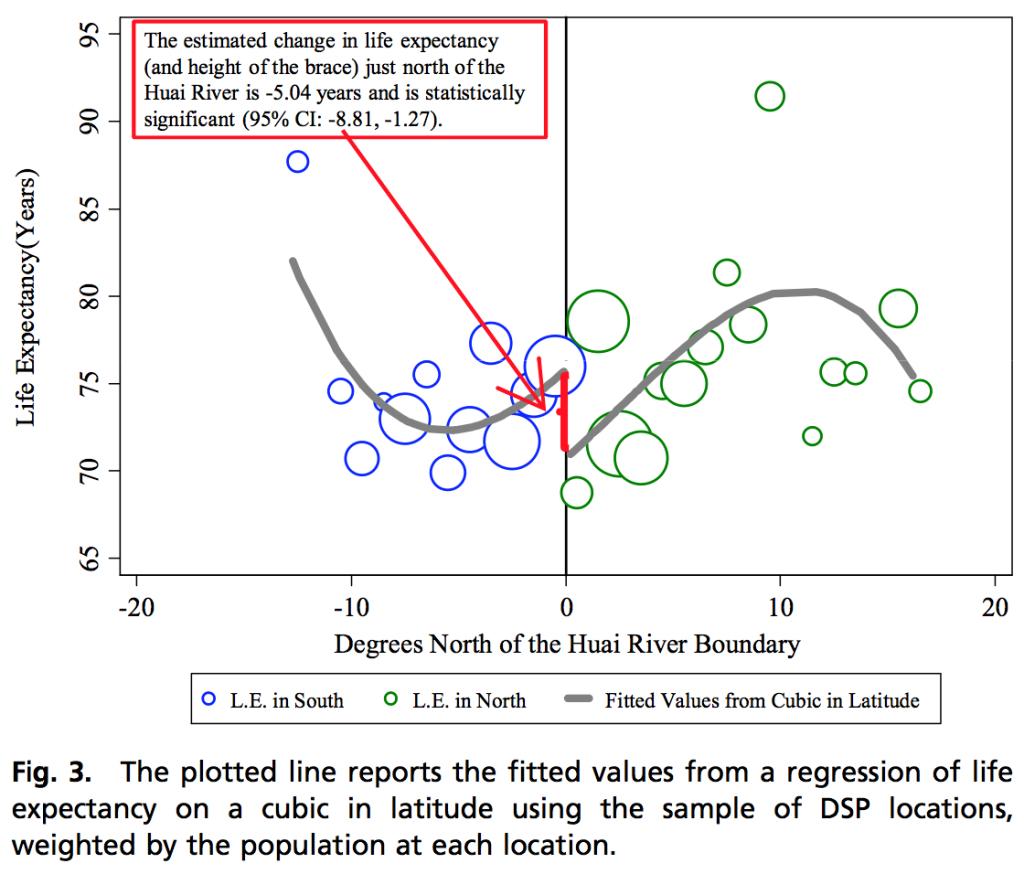
I think DeLong is mistaken here. But, before getting to this, here’s the graph:
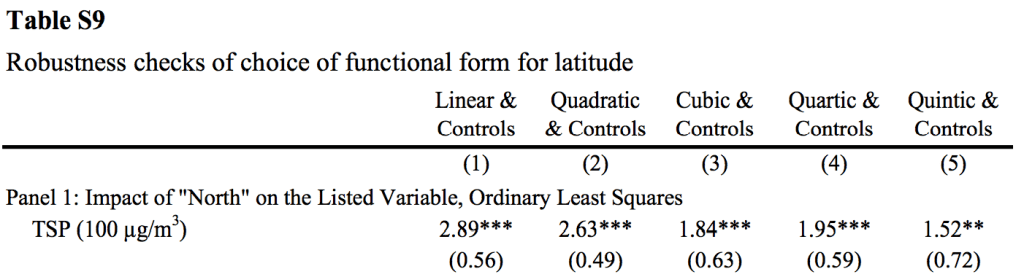
and here are the regression results:
![]()
So, indeed it is that cubic term that takes the result into statistical significance.
The reason I disagree with DeLong is that it’s my impression that, in econometrics and applied economics, it’s considered the safe, conservative choice in regression discontinuity to control for a high-degree polynomial. See the paper discussed a few years ago here, for example, where I criticized a pair of economists for using a fifth-degree specification and they replied, “the regression discontinuity methods we use in the paper (including the 5th degree polynomial) are standard in economics (see for example the 2009 working paper on R&D implementation by David Lee and Thomas Lemiuex).”
As we’ve discussed on this blog at other times, many methodologists (especially, but certainly not only, in economics) have a naive belief that they should be using unbiased estimates (not recognizing that, in practice, unbiasedness at one point the analysis is achieved at the expense of averaging over some other dimension such as time), and it would seem that, the higher degree the polynomial correction, the lower the bias. In which case the four additional degrees of freedom required to ramp up from a linear to a 5th-degree adjustment are a small price to pay if you have a large or even moderate sample size.
And in this case, sure, the cubic polynomial looks ridiculous, but a linear fit would be even worse (as the authors found using their model-fit statistics). I’m guessing that the authors were doing what they thought was right and proper by choosing the best-fitting of these polynomials.
What if the result had been statistically significant with linear adjustment but not with a higher-degree polynomial? What would the authors have done? Would they have presented the statistically significant linear result and stopped there? I have no idea. But, given my impression of how economists think about regression discontinuity analysis, my guess is that, given the data the authors did see, that they did not do a specification search; they just did what they thought was the most kosher analysis possible.
Why this is important
If Chen et al. had violated the rules of the game (in this case, not by faking or improperly discarding data but by trying analysis after analysis in a search for statistical significance), this would be a problem, but it’s a containable problem. The rules are (relatively clear), and you’re not supposed to break them.
But I think the problem is worse than that. I think Chen et al. did what, under current doctrine, they were supposed to do: find a discontinuity and adjust using a high-degree polynomial. When the recommended analysis has such problems of face validity, that’s a different problem entirely.
As the (sometimes) great Michael Kinsley once said, in a different context, “the scandal isn’t what’s illegal, the scandal is what’s legal.”
P.S. Just to clarify: Not only do I not think that Chen et al.
“cheated” (in the sense of trying out many specifications in a search for statistical significance), I never thought so. As I wrote in my original post, I applaud the authors’ directness in graphing their model which reveals its problems. My post title, “I doubt they cheated,” is specifically in response to Brad DeLong’s feeling that they “tortured the data via specification search.” For the reasons described above, I don’t think they did.
What a joke. Even the data-driven economists have to do such shoddy work and have professional standards that betray ignorance? You expect that from the money, ego, and ideology driven shills who want us all to believe in their fantasy world built around a few fanciful differential equations with no relation to the real world. But even the reality based micro folks let this pass review? Just from the graph it’s such an OBVIOUS joke.
“Given my impression of how economists think about regression discontinuity analysis, my guess is that, given the data the authors did see, that they did not do a specification search; they just did what they thought was the most kosher analysis possible”
Andrew, you must be one of the most generous-minded academics on the planet…. My view: most empirical analyses in econ these days are suspect, why should this one be different?
I’m really not super keen on being the one to defend this paper, but I do want to defend it against what I think are unfair criticisms (as opposed to totally valid ones, of which there are many).
So just to get it out there – they show the results using linear, quadratic, 3rd, 4th, and 5th degree polynomials in their linked, free appendix. The results are not significant at linear and quadratic, and are significant for 3rd and higher. But they are all the same sign, and tell a qualitatively similar story. Furthermore, they show the results using other latitude cutoffs and a number of other issues (measurement of TSPs, other functional forms, etc.).
You could argue that they chose their “preferred” specification because it had nice p-values, but so did other specifications, and they clearly do not try to hide anything. I mean, they even hyper-link the robustness/appendix tables, repeatedly. To my mind this is a great example of a paper that succinctly makes a point, but does everything it can to be open and clear with the totality of the analysis they conducted.
So here are all the analyses that did not show up in the printed paper, which has to be short so as to be publishable.
http://www.pnas.org/content/suppl/2013/07/03/1300018110.DCSupplemental/sapp.pdf
I agree with you, I don’t think this was a case of trying to hide anything, I think it was a case of honestly believing that this was a good method, but being most likely wrong in this case (IMHO).
I agree as well. A good paper shows what was done and gives robustness checks; this paper does that. If you’re a p-value zealot, the robustness checks might convince you there’s nothing there. On the other hand, 5 different polynomials all have the same sign, which, if the methods were independent (which they aren’t) and there was no effect, would only happen 1 time in 32. (Yes, nonindependence raises that value… I don’t really care.) Plus the direction of the change makes sense. If you want to say it’s fragilely measured, I couldn’t disagree with you… but I’m more informed by their noisy estimate than I was before I read the paper. That’s my definition of science.
Jonathan said: “but I’m more informed by their noisy estimate than I was before I read the paper”
Except you may not be… you may now believe that something statistically significant has taken place when it really may not have. Graphically, the higher the polynomial, the more the tail end of the lines influences the paper’s central result — the difference between the north and south at 0 degrees. It’s this tail that worries me… if the cubic were fixed so an inflection point existed at 0 degrees that would be one thing, but it’s not. Since there is a slight increase in longevity at the nearest bubble in the south (from the second nearest), and a huge decrease in longevity to the bubble nearest zero from the north (due, in large part, to the second closest bubble seeming somewhat out of band… I’d like to see confidence intervals around the entire cubic here), the noise is exacerbated.
Another way of saying it is that, in order to believe the statistically significant result (that there is a difference in life expectancy north vs. south of the river correlated to distance), you must believe that the difference follows a curve… that further away from the river the problem gets better before it gets worse in the north, and the problem gets worse before it gets better in the south. While this may be the case, it does not support the basic premise of the paper. Worse yet, the extrapolations for total years-of-life-lost appear to not take the entire curve into consideration… they focus only on the gap at 0 degrees.
I actually think Andrew may be understating the severity a bit. It may be common economic process to fit high dimension polynomials to data, and it sounds like we agree this may be playing too loose with the statistics by itself, even if it’s accepted. But this example is worse than simply fitting a cubic… it fits TWO polynomials split by the hypothesis (the river) and made no apparent effort to bound the cubic in any way. In a way, they presupposed their intended result — that the two sets (north and south) behaved as two data-sets instead of one. In economics it may be ok to ignore bounds, since negatives, exceptionally small or exceptionally large results have no real meaning (for example hyperinflation is real). But in life sciences, there are natural bounds… one does not actually expect the curve fit to function… at -20 degrees latitude, life expectancy is simply not above 95 years as the curve predicts.
Worse yet, this isn’t even the paper’s intended result. Latitude is used as a proxy to measure TSP’s affect on life expectancy, but the paper has a mechanism to do this directly rather than indirectly (since the mortality and air quality results are aggregated at a city level, where the DSPs are located). The paper’s final conclusions are based not on the actual collected data, but on a comparison of PROJECTED data, using the cubic, where real data was available. Definitely seems fishy to me.
“Except you may not be… you may now believe that something statistically significant has taken place when it really may not have.”
Ummm… no. The noisiness subtracts from the statistical significance and moves me to teh realm of something I call… may be significant. that what i mean by noisy estimate. I get the artifactuality of the polynomials… that’s why I’m not misled.
And I hasten to add that that that doesn’t make the paper right, just publishable, and readable by someone prepared to grapple with the fragilities in the paper. For those unprepared to grapple or looking for a prop for some other prior opinion, tant pis for them.
One of the things that we do as readers is that we assume that the person that knows a paper’s data best is the authors. I believe that most people in social sciences are doing their best to do honest research. There is no reason to believe that these authors did anything unethical. If you don’t like this paper, I am sure there are others on this topic one can cite. We often have data that’s rough around the edges in social sciences. Worrying about the perfect method the analysis a model with rough data is just plan silly. The authors found a model they were comfortable putting their name on it. If you would do it different, then do it different. Submit it to the journal with an explanation why your model is the correct one. That is not that hard.
John:
Submitting to the journal is not so easy, as in my experience journals have a high bar for publishing a correction. I posted here on the blog because this is much easier to me. I’d rather spend my time thinking about the issues and moving on to the next problem, than working on submitting something to the journal, dealing with referees, etc.
I feel that the trusting approach @John Dickey advocates may be very courteous to our fellow researchers but very dangerous to the progress of our knowledge. A healthy dose of skepticism is absolutely essential while judging new work and if anywhere social science needs this attitude more than anything.
It isn’t a question of academic haggling about the perfect method as you make it out to be; what’s at stake in a lot of these studies is authors using a questionable logic to derive their conclusions. It’s a question of whether the effect is real or illusory. And that has real-world policy implications.
Uncritically assuming that all authors are honest and ethical is naive, furthermore there are various skewed incentives at play. Besides bad reasoning is not necessarily due to dishonesty: one has to factor in ignorance, sloppiness, haste and many other factors.
I’ve been trying to understand what exactly is wrong with a cubic polynomial. You mention that it has no “scientific” basis. But it is rarely the case in social science that we have good theory guiding the choice of functional form. What would you prefer to see? A bayesian multilevel model doesn’t absolve us of having to making assumptions about how group means vary with location. So I’m curious–if you were refereeing this paper, what specific suggestions would you make to the authors?
Js:
If there was a desire to fit a nonparametric model, I’d fit a spline or Gaussian process, not a polynomial. And, probably more importantly, I’d fit a hierarchical model. There’s a lot of variation from dot to dot in that picture. The short story is there seems to be a lot of unexplained variation at the level of city or region or whatever.
The trouble with the cubic is that much of that estimate of 5.5 years is coming in to counteract that big negative slope of the line near zero. But that big negative slope seems model dependent. More than half the magnitude of the estimate is relying on their being some natural gradient going in the opposite direction of the effect.
When I say that the model has no scientific basis, that’s not intended to be a damning criticism. My point is that the inference is highly model-dependent, so we have to be careful. If inference is highly model-dependent but the model has a scientific basis (as in pharmacokinetics, for example), I’m not so bothered. We still should understand the model dependence, but it makes sense to go with a model with a scientific justification, at least as a starting point. But when the model’s justification is purely from data-fitting (as here) along with an odd (to me) convention of choosing polynomials, I get worried.
Also, as a referee, I would not demand statistical significance. As I wrote above, this is an important problem, and if their results have a big standard error, so be it.
What’s interesting to me is the comments on this and the earlier post. They’re all essentially about polynomial fitting, degrees, etc. When I read the paper, what struck me is the lack of discussion of the fact I mentioned in another comment, that respiratory deaths are higher on the wrong side of the river. If you then look at how the “cardiorespiratory deaths” are grouped, that raises the question: how much is stroke part of this pollution exposure? If we just looked at respiratory illness deaths, which I’d think would be the first alarm raised by pollution, we’d say the other side of the river was worse … but that goes away when you include stroke, which is more indirectly related, and then heart disease, which is also indirectly related. As in, I can show you pictures of lungs that breathe stuff and look blackened and I can demonstrate a correlation between exposure and death. But the paper doesn’t discuss the correlations they claim for stroke or heart disease and don’t put those in a model which explains why respiratory illness would go the other way.
To me, this speaks of a real problem in statistics: that you can fit all sorts of models but the truth underlying them depends on clearly identifying and analyzing the data so it makes sense. I don’t see sense at the basic design/explanation level. Arguing about whether a 3rd degree polynomial is good is, to me, like arguing about whether Mothra would beat Godzilla.
Jonathan:
I take your point, but there is a connection between the high-degreee polynomial and the slope having the wrong sign. It is the high-degree polynomial that allows the fit to “adjust” for this slope, thus producing such a high estimate.
Thank you. I understand that aspect of the discussion.
But my problem with the paper is aimed at something you discuss fairly often: whether the model models what it says it models. I don’t know why this particular paper keeps popping up in my brain but I think it fails at the basic design level. I mistrust the inclusion of stroke data because the main causes of stroke are essential (genetic) and the difference in mortality rates by areas could be a combination of somewhat more similar people, in some cases related and in other cases from the same areas originally. Or once the genetic portion is excluded, the rest could be chance that disappears if you expand the survey area. And I didn’t go into age factors and the like in their data or generally. I know this discussion is about how the effects appear at a higher order, but I can’t get there because the basic design at the level of looking at mortality feels bad.
Why not collect rodents at either side of the cutoff? Check their lungs, etc…
I have not read the paper but it seems to me that pollution will be identical at either river bank.
There appears to be a sharp discontinuity in the legislation but not in the exposure to pollution, which I guess differs more as we move away from the river.
If you think of it in terms of IV and ETT, it would appear most compliers with pollution regimen would be far from the cutoff
I’d like to say thank you for discussing this paper/these data. I think that it’s very interesting and one can learn a lot from it.
My personal impression is that looking at the data minus the lines from the fitted model, I probably wouldn’t think that there is evidence in favour of any regular function underlying these data (though I can’t be 100% sure having seen the fit first). Observations far away from the border don’t seem to carry information about what goes on at the border (but they get some influence by the author’s methodology, which seems inappropriate).
What could count as “visual evidence” in favour of the authors’ statements is that around the borderline one could with some goodwill see two somewhat separated “clusters” of increase (although I’m a cluster analysis expert so I see clusters everywhere), one comprising all blue and one green observation, the other one all green observations. The “gap” in the author’s model corresponds to the “gap” between them. No idea how “significant” I think this is.
What I think could be helpful here, coming up with some kind of meaningful p-value, is Buja et al.s approach to “visual inference,
“Statistical inference for exploratory data analysis and model diagnostics” (Buja, Cook, Hofmann, Lawrence, Lee, Swayne, Wickham, 2009; Philosophical Transactions of The Royal Society, A), available on A. Buja’s website http://www-stat.wharton.upenn.edu/~buja/.
One would need an intelligent null model incorporating if possible all features of the data that are not directly connected to such a kind of gap, produce 99 plots from simulated data, mix the real one in, and ask one or more statisticians who don’t know the data to pick the five most likely candidates for “something going on at the borderline”.
Pingback: Links for 08-09-2013 | Symposium Magazine
Look: I believe the linear specification. I think the linear specification is important. I think the paper should be published and highlighted based on the linear specification. I think it is good to run 0 through 5 degree polynomials and report them.
Where it goes wrong is that they feel forced in the body of the paper to highlight the third-degree polynomial specification taht tells us that ceteris paribus you live 14 years longer if you live 10 degrees north than if you live 5 degrees south of the Huai River–and yet longer still if you live 15 degrees south. That just does not make sense.
Smart people do not highlight nonsensical specifications without powerful reason to do so. That’s what I am saying…
Brad:
I don’t believe the linear specification or any of the polynomials. I suggested a multilevel model to capture some of the unexplained variation. My point above is that it seems like standard practice in economics to think that higher-degree polynomials are preferred. From that perspective, choosing the high-degree polynomial is the sober, careful choice, whereas highlighting the linear model would be improper. You refer to “powerful reason”; in this case I think that the accepted convention in econometrics is that powerful reason.
It seems to me that economists’ emphasis on bias is related to their emphasis on statistical significance — given that only significant results can be published, wouldn’t allowing biased estimates compound the problem of publication bias?
My sense is that in economics higher order polynomials are only acceptable when there is theoretical justification for including it. If you can’t theoretically justify it, it isn’t kosher. Certainly running the model up to 5th(!) order simply to find the ‘best fit’ is not good practice. (There are a few theoretical situations where 5th order polynomials are appropriate, but they are vanishingly rare.)
In this case, ita appears on the face of it that a lot of the heavy lifting for calling this a cubic is being done by the one outlier at 88years by -11 degrees. If you need an unusual bit of data at a distance from the breakpoint to justify assumptions necessary to find the breakpoint, you probably have a bad model. To the eye, it looks to me like the correct break, if there is one, is about 2-3 degrees NORTH of the river – I rather suspect that ‘distance from river’ is proxying somehow for some relevant excluded variables – urban/rural, wealth, distance to medical facilities, education, something. (At a guess, the Huai river, like most Chinese rivers, is extremely prone to flooding, and has an odd relationship with a different river to the north. It could be that the lands ‘near’ the river’ north are relatively swampy, flood prone, rural, or otherwise unhealthy, and this is causing the breakpoint.)
But this is one of many places where the ex-ante (or just other outside of your regression) data/information is so important to consider. Is there other information you have which would be evidence for a specification shape like this making sense? Sometimes there may be. You really hurt your analysis when you only look at the information in the regression.
I like to give a story of two economists hiking and one eats some berries and immediately dies. The other then says, it’s only a sample of one, not significant, and he eats some and dies too. The moral, consider all relevant information, not just what’s in your regression, things like the similarity of human’s biology.
Richard:
Yup. Priors. One of my regrets in BDA is that we don’t have enough examples with informative priors.