Why “Why”?

In old books (and occasionally new books), you see the word “Why” used to indicate a pause or emphasis in dialogue.

For example, from 1952:

“Why, how perfectly simple!” she said to herself. “The way to save Wilbur’s life is to play a trick on Zuckerman. “If I can fool a bug,” thought Charlotte, “I can surely fool a man. People are not as smart as bugs.”

That line about people and bugs was cute, but what really jumped out at me was the “Why.” I don’t think I’ve ever ever heard anyone use “Why” in that way in conversation, but I see it all the time in books, and every time it’s jarring.

What’s the deal? Is it that people used to talk that way? Or is a Wasp thing, some regional speech pattern that was captured in books because it was considered standard conversational speech? I suppose one way to learn more would be to watch a bunch of old movies. I could sort of imagine Jimmy Stewart beginning his sentences with “Why” all the time.

Does anyone know more?

P.S. I used to live in the same building as the guy who discovered the etymology of O.K. He did that around 1940 but was still around sixty years later. I bet he would’ve known all about “Why.”

Those darn physicists

X pointed me to this atrocity:

The data on obesity are pretty unequivocal: we’re fat, and we’re getting fatter. Explanations for this trend, however, vary widely, with the blame alternately pinned on individual behaviour, genetics and the environment. In other words, it’s a race between “we eat too much”, “we’re born that way” and “it’s society’s fault”.
Now, research by Lazaros Gallos has come down strongly in favour of the third option. Gallos and his colleagues at City College of New York treated the obesity rates in some 3000 US counties as “particles” in a physical system, and calculated the correlation between pairs of “particles” as a function of the distance between them. . . . the data indicated that the size of the “obesity cities” – geographic regions with correlated obesity rates – was huge, up to 1000 km. . . .

Just to be clear: I have no problem with people calculating spatial autocorrelations (or even with them using quaint terminology such as referring to counties as “particles in a physical system”). I do have problems with this sort of gee-whiz reporting and the leap from an autocorrelation function to “it’s society’s fault.”

Reference on longitudinal models?

Antonio Ramos writes:

The book with Hill has very little on longitudinal models. So do you recommended any reference to complement your book on covariance structures typical from these models, such as AR(1), Antedependence, Factor Analytic, etc? I am very much interest in BUGS code for these basic models as well as how to extend them to more complex situations.

My reply:

There is a book by Banerjee, Carlin, and Gelfand on Bayesian space-time models. Beyond that, I think there is good work in psychometrics on covaraince structures but I don’t know the literature.

Confusion from illusory precision

When I posted this link to Dean Foster’s rants, some commenters pointed out this linked claim by famed statistician/provacateur Bjorn Lomberg:

If [writes Lomborg] you reduce your child’s intake of fruits and vegetables by just 0.03 grams a day (that’s the equivalent of half a grain of rice) when you opt for more expensive organic produce, the total risk of cancer goes up, not down. Omit buying just one apple every 20 years because you have gone organic, and your child is worse off.

Let’s unpack Lomborg’s claim. I don’t know anything about the science of pesticides and cancer, but can he really be so sure that the effects are so small as to be comparable to the health effects of eating “just one apple every 20 years”?

I can’t believe you could estimate effects to anything like that precision. I can’t believe anyone has such a precise estimate of the health effects of pesticides, and also I can’t believe anyone has such a precise effect of the health effect of eating an apple. Put it together and we seem to be in a zero-divided-by-zero situation.

Maybe you have to write in this sort of hyper-overconfident way in order to get press? To me it seems a bit tacky.

P.S. In any case, I doubt Lomborg is entirely serious in his column; he also writes that cutting CO2 emissions would save “less than one-tenth of a polar bear” yearly, which again seems to imply an implausible (to me) precision. Again, not something I like to see from a statistician.

Calibration!

I went to this place a few months ago after it was reviewed in the Times and I was not impressed at all. Not that I’m any kind of authority on barbecue, this just makes me aware of variation in assessments. Food criticism is like personality profiling in psychometrics: there is no objective truth to measure; any meaningful evaluation is inherently statistical.

Facebook Profiles as Predictors of Job Performance? Maybe…but not yet.

Eric Loken explains:

Some newspapers and radio stations recently picked up a story that Facebook profiles can be revealing, and can yield information more predictive of job performance than typical self-report personality questionnaires or even an IQ test. . . .

A most consistent finding from the last 50 years of organizational psychology research is that cognitive ability is the strongest predictor of job performance, sometimes followed closely by measures of conscientiousness (and recently there has been interest in perseverance or grit). So has the Facebook study upended all this established research? Not at all, and the reason lies in the enormous gap between the claims about the study’s outcomes, and the details of what was actually done.

The researchers had two college population samples. In Study 1 they had job performance ratings for the part-time college jobs of about 10% of the original sample. But in study 1 they did not have any IQ or cognitive ability measure. In Study 2 they gathered Wonderlic’s measure of cognitive ability, but this time they had no job performance data but rather college GPA which they say is correlated with job performance. . . . All in all this particular research has very little of value to add about predicting job performance in any real world setting.

Untangling the Jeffreys-Lindley paradox

Ryan Ickert writes:

I was wondering if you’d seen this post, by a particle physicist with some degree of influence. Dr. Dorigo works at CERN and Fermilab.

The penultimate paragraph is:

From the above expression, the Frequentist researcher concludes that the tracker is indeed biased, and rejects the null hypothesis H0, since there is a less-than-2% probability (P’<α) that a result as the one observed could arise by chance! A Frequentist thus draws, strongly, the opposite conclusion than a Bayesian from the same set of data. How to solve the riddle?

He goes on to not solve the riddle. Perhaps you can?

Surely with the large sample size they have (n=10^6), the precision on the frequentist p-value is pretty good, is it not?

My reply:

The first comment on the site (by Anonymous [who, just to be clear, is not me; I have no idea who wrote that comment], 22 Feb 2012, 21:27pm) pretty much nails it: In setting up the Bayesian model, Dorigo assumed a silly distribution on the underlying parameter. All sorts of silly models can work in some settings, but when a model gives nonsensical results—in this case, stating with near-certainty that a parameter equals zero, when the data clearly reject that hypothesis—then, it’s time to go back and figure out what in the model went wrong.

It’s called posterior predictive checking and we discuss it in chapter 6 of Bayesian Data Analysis. Our models are approximations that work reasonably well in some settings but not in others.

P.S. Dorigo also writes:

A Bayesian researcher will need a prior probability density function (PDF) to make a statistical inference: a function describing the pre-experiment degree of belief on the value of R. From a scientific standpoint, adding such a “subjective” input is questionable, and indeed the thread of arguments is endless; what can be agreed upon is that in science a prior PDF which contains as little information as possible is mostly agreed to be the lesser evil, if one is doing things in a Bayesian way.

No. First, in general there is nothing more subjective about a prior distribution than about a data model: both are based on assumptions. Second, if you have information, then it’s not “the lesser evil” to include it. It’s not evil at all! See, for example, the example in Section 2.8 of Bayesian Data Analysis.
Continue reading

Philosophy: Pointer to Salmon

Larry Brownstein writes:

I read your article on induction and deduction and your comments on Deborah Mayo’s approach and thought you might find the following useful in this discussion. It is Wesley Salmon’s Reality and Rationality (2005). Here he argues that Bayesian inferential procedures can replace the hypothetical-deductive method aka the Hempel-Oppenheim theory of explanation. He is concerned about the subjectivity problem, so takes a frequentist approach to the use of Bayes in this context.

Hardly anyone agrees that the H-D approach accounts for scientific explanation. The problem has been to find a replacement. Salmon thought he had found it.

I don’t know this book—but that’s no surprise since I know just about none of the philosophy of science literature that came after Popper, Kuhn, and Lakatos. That’s why I collaborated with Cosma Shalizi. He’s the one who connected me to Deborah Mayo and who put in the recent philosophy references in our articles. Anyway, I’m passing on the above pointer for the benefit of those of you out there who know about these things.

I’m officially no longer a “rogue”

In our Freakonomics: What Went Wrong article, Kaiser and I wrote:

Levitt’s publishers characterize him as a “rogue economist,” yet he received his Ph.D. from MIT, holds the title of Alvin H. Baum Professor at the University of Chicago, and has served as editor of the completely mainstream Journal of Political Economy. Further “rogue” credentials revealed by Levitt’s online C.V. include an undergraduate degree from Harvard, a research fellowship with the American Bar Foundation, membership in the Harvard Society of Fellows, a fellowship at the National Bureau of Economic Research, and a stint as a consultant for “Corporate Decisions, Inc.”

That’s all well and good, but, on the other hand, I too have degrees from Harvard and MIT and I also taught at the University of Chicago. But what really clinches it is that this month I gave a talk for an organization called the Corporate Executive Board. No kidding.

In my defense, I’ve never actually called myself a “rogue.” But still . . .

“Readability” as freedom from the actual sensation of reading

In her essay on Margaret Mitchell and Gone With the Wind, Claudia Roth Pierpoint writes:

The much remarked “readability” of the book must have played a part in this smooth passage from the page to the screen, since “readability” has to do not only with freedom from obscurity but, paradoxically, with freedom from the actual sensation of reading [emphasis added]—of the tug and traction of words as they move thoughts into place in the mind. Requiring, in fact, the least reading, the most “readable” book allows its characters to slip easily through nets of words and into other forms. Popular art has been well defined by just this effortless movement from medium to medium, which is carried out, as Leslie Fiedler observed in relation to Uncle Tom’s Cabin, “without loss of intensity or alteration of meaning.” Isabel Archer rises from the page only in the hanging garments of Henry James’s prose, but Scarlett O’Hara is a free woman.

Well put. I wish Pierpoint would come out with another book. But I think this sort of book is out of fashion nowadays. There are zillions of uncollected book reviews and literary essays that I’d love to see in book form (the hypothetical collected reviews of Anthony West, Alfred Kazin, and many others) but it seems like it won’t ever happen.

Joshua Clover update

Surfing the blogroll, I found myself on Helen DeWitt’s page and noticed the link to the Joshua Clover, alias Jane Dark. I hadn’t checked out Clover for awhile (see my reactions here and here), so I decided to head on over.

Here’s what it looked like:

“The case against the Federal minimum wage,” huh? That surprised me, as I had the vague impression that Clover was on the far left of the American political spectrum. But I guess he could have some sort of wonky thing going on, or maybe there’s some unexpected twist? It seemed a bit off of Clover’s usual cultural-criticism beat, so I clicked through to take a look . . . and it was just a boring set of paragraphs on the minimum wage.

Hmmmm. I went back to the homepage, looked around more carefully, and realized that the blog is fake, the online equivalent of those fake book spines that are used to simulate rows of books on a bookshelf.

I don’t know what happened. My guess is that Clover got tired of blogging and let the domain name lapse, and then some loser entrepreneur noticed it was still getting some hits (from DeWitt’s blog?) so they put up a fake blog.

I can only assume it was all done automatically? Somebody has a webcrawler that looks for dead sites with links, then buys them up for something close to $0 and fills ’em with crap? Yuck.

Factual – a new place to find data

Factual collects data on a variety of topics, organizes them, and allows easy access. If you ever wanted to do a histogram of calorie content in Starbucks coffees or plot warnings with a live feed of earthquake data – your life should be a bit simpler now.

Also see DataMarket, InfoChimps, and a few older links in The Future of Data Analysis.

If you access the data through the API, you can build live visualizations like this:

Of course, you could just go to the source. Roy Mendelssohn writes (with minor edits):

Since you are both interested in data access, please look at our service ERDDAP:

http://coastwatch.pfel.noaa.gov/erddap/index.html

http://upwell.pfeg.noaa.gov/erddap/index.html

Please do not be fooled by the web pages. Everything is a service (including search and graphics) and the URL completely defines the request, and response formats are easily changed just by changing the “file extension”. The web pages are just html and javascript that use the services. For example, put this URL in your browser:

http://coastwatch.pfeg.noaa.gov/erddap/griddap/erdBAsstamday.png?sst[(2010-01-16T12:00:00Z):1:(2010-01-16T12:00:00Z)][(0.0):1:(0.0)][(30):1:(50.0)][(220):1:(240.0)]

Now if you use R:

library(ncdf4)

library(lattice)

download.file(url="http://coastwatch.pfeg.noaa.gov/erddap/griddap/erdBAsstamday.nc?sst[(2010-01-16T12:00:00Z):1:(2010-01-16T12:00:00Z)][(0.0):1:(0.0)][(30):1:(50.0)][(220):1:(240.0)]", destfile="AGssta.nc")

AGsstaFile<-nc_open('AGssta.nc')

sst<-ncvar_get(AGsstaFile,'sst',start=c(1,1,1,1),count=c(-1,-1,-1,-1))

lonval<-ncvar_get(AGsstaFile,'longitude',1,-1)

latval<-ncvar_get(AGsstaFile,'latitude',1,-1)

image(lonval,latval,sst,col=rainbow(30))

Or if you use Matlab:

link='http://coastwatch.pfeg.noaa.gov/erddap/griddap/erdBAsstamday.mat?sst[(2010-01-16T12:00:00Z):1:(2010-01-16T12:00:00Z)][(0.0):1:(0.0)][(30):1:(50.0)][(220):1:(240.0)]';

F=urlwrite(link,'cwatch.mat');

load('-MAT',F);

ssta=reshape(erdBAsstamday.sst,201,201);

pcolor(double(ssta));shading flat;colorbar;

The two services above allow access to literally petabytes of data, some observed some from model output. I realize you guys don’t usually work in these fields, but this is part of a significant NOAA effort to make as much of its data available as possible. One more thing, if you use “last” as the time, you will always get the latest data, This allows people to set up web pages that track the latest (algal bloom) conditions, such as done by one of my colleagues.

BTW – for people who want a GUI to help with the extract from within the app, there is a product called the Environmental Data Connector that runs in ArcGIS, Matlab, R and Excel.

Roy’s links inspired me to write another blog post, which is forthcoming.

This post is by Aleks Jakulin, follow him at @aleksj.

Standardized writing styles and standardized graphing styles

Back in the 1700s—JennyD can correct me if I’m wrong here—there was no standard style for writing. You could be discursive, you could be descriptive, flowery, or terse. Direct or indirect, serious or funny. You could construct a novel out of letters or write a philosophical treatise in the form of a novel.

Nowadays there are rules. You can break the rules, but then you’re Breaking. The. Rules. Which is a distinctive choice all its own.

Consider academic writing. Serious works of economics or statistics tend to be written in a serious style in some version of plain academic English. The few exceptions (for example, by Tukey, Tufte, Mandelbrot, and Jaynes) are clearly exceptions, written in styles that are much celebrated but not so commonly followed.

A serious work of statistics, or economics, or political science could be written in a highly unconventional form (consider, for example, Wallace Shawn’s plays), but academic writers in these fields tend to stick with the standard forms. The consensus seems to be that straight prose is the clearest way to convey interesting and important ideas. Serious popular writers such as Oliver Sacks and Malcolm Gladwell follow a slightly different formula, going with the magazine-writing tradition of placing ideas inside human stories. But they still, by and large, are trying to write clear prose.

When it comes to data graphics, though, we’re back in the freewheeling 1700s. Maybe that’s a good thing, I don’t know. But what I do know is there’s no standard way of displaying quantitative information, nor is there any acceptance of the unique virtues of the graphical equivalent of clear prose.

Serious works of social science nowadays use all sorts of data display, from showing no data at all, to tables, to un-designed Excel-style bar charts, to Cleveland-style dot and line plots, to creative new data displays, to ornamental information visualizations. The analogy in writing style would be if some journal articles were written in the pattern of Ezra Pound, others like Ernest Hemingway, and others in the style of James Joyce or William Faulkner.

I won’t try to make the case that everybody should do graphs the way I do. I accept that some people communicate with tables, others prefer infovis, and others prefer no quantitative information at all. I just think it’s interesting that prose style is so standardized—I’ve had submissions to journals criticized on the grounds that my writing is too lively!—but when it comes to display of data and models, it’s the Wild West.

For example . . .

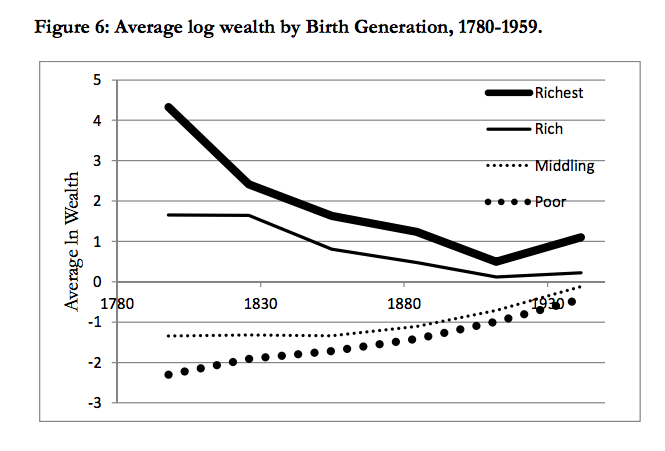
Kaiser points to this graph from the book Poor Economics by Abhijit Banerjee and Esther Duflo:

In case you’re curious what’s actually going on here, Kaiser helpfully replots the data in a readable form:

I’d be interested in what my infovis friends would say about this. The best argument I can think of in favor of the Banerjee and Duflo graph, besides its novelty and (perhaps) attractiveness, is that its very difficulty forces the reader to work, to put in so much effort to figure out what’s going on that he or she is then committed to learning more. In contrast, one might argue that Kaiser’s direct plot is so clear that the reader can feel free to stop right there. I don’t really believe this argument—I’d rather have the clear graph and convey more information—but that’s the best I can do.

That said, if a book has dozens of informative Kaiser-style graphs, I can see the benefit of having a few goofy ones just to mix things up a bit.

Not as ugly as you look

Kaiser asks the interesting question: How do you measure what restaurants are “overrated”? You can’t just ask people, right? There’s some sort of social element here, that “overrated” implies that someone’s out there doing the rating.

Rare name analysis and wealth convergence

Steve Hsu summarizes the research of economic historian Greg Clark and Neil Cummins:

Using rare surnames we track the socio-economic status of descendants of a sample of English rich and poor in 1800, until 2011. We measure social status through wealth, education, occupation, and age at death. Our method allows unbiased estimates of mobility rates. Paradoxically, we find two things. Mobility rates are lower than conventionally estimated. There is considerable persistence of status, even after 200 years. But there is convergence with each generation. The 1800 underclass has already attained mediocrity. And the 1800 upper class will eventually dissolve into the mass of society, though perhaps not for another 300 years, or longer.

Read more at Steven’s blog. The idea of rare names to perform this analysis is interesting – and has been recently applied to the study of nepotism in Italy.

I haven’t looked into the details of the methodology, but rare events have their own distributional characteristics, and could benefit from Bayesian modeling in sparse data conditions. Moreover, there seems to be an underlying assumption that rare names are somehow uniformly represented in the population. They might not be. A hypothetical situation: in feudal days, rare names were good at predicting who’s rich and who’s not – wealth was passed through family by name. But then industrialization perturbed the old feudal order stratified by name into one that’s stratified by skill and no longer identifiable by name.

Let’s scrutinize this new methodology! With power comes responsibility.

This post is by Aleks Jakulin.

Sports examples in class

Karl Broman writes:

I [Karl] personally would avoid sports entirely, as I view the subject to be insufficiently serious. . . . Certainly lots of statisticians are interested in sports. . . . And I’m not completely uninterested in sports: I like to watch football, particularly Nebraska, Green Bay, and Baltimore, and to see Notre Dame or any team from Florida or Texas lose.

But statistics about sports? Yawn.

As a person who loves sports, statistics, and sports statistics, I have a few thoughts:

1. Not everyone likes sports, and even fewer are interested in any particular sport. It’s ok to use sports examples, but don’t delude yourself into thinking that everyone in the class cares about it.

2. Don’t forget foreign students. A lot of them don’t even know the rules of kickball, fer chrissake!

3. Of the students who care about a sport, there will be a minority who really care. We had some serious basketball fans in our class last year.

4. I think the best solution is to cover examples in all sorts of topics, including but not limited to sports. I’ve been trying to work in more examples from areas such as cooking, sewing, and shopping.

5. In my experience, students looove education examples, stories about grades, studying, and so forth. But maybe that’s just at the sorts of colleges where I’ve taught: Columbia, Harvard, Berkeley, Chicago. Perhaps students at less elite institutions are less interested in grades.

6. Getting back to Karl’s point about sports being unimportant: Yeah, I pretty much agree with him on that one. Psychologists and economists who study sports will make the claim that the research has larger value, for example in studying decision making or in isolating some cognitive process (as in the justly-celebrated “hot-hand” study), but ultimately I think sports are valuable for their own sake. Sports are a form of art, it’s not a topic such as medicine or education that has much interest beyond itself. That’s ok, though, as long as we’re honest about it, and as long as we also include examples that interest other students in the class.

7. Whenever you teach an applied example well, you induce some subject-matter learning. When I teach sex ratios of births, I give the probability as 0.485, not 0.5, and students learn a little bit of biology. When I teach a sports example, students learn a bit about sports and psychology (for example, the hot hand). The one thing I never never like to do is use complicated gambling examples. I have no interest in teaching students the rules of craps or the probability of getting three of a kind in a poker hand. There are lots of probability examples out there that have the same level of complexity but apply to real-world situations.