Ryan King writes:
This involves causal inference, hierarchical setup, small effect sizes (in absolute terms), and will doubtless be heavily reported in the media.
The article is by Manudeep Bhuller, Tarjei Havnes, Edwin Leuven, and Magne Mogstad and begins as follows:
Does internet use trigger sex crime? We use unique Norwegian data on crime and internet adoption to shed light on this question. A public program with limited funding rolled out broadband access points in 2000-2008, and provides plausibly exogenous variation in internet use. Our instrumental variables and fixed effect estimates show that internet use is associated with a substantial increase in reported incidences of rape and other sex crimes. We present a theoretical framework that highlights three mechanisms for how internet use may affect reported sex crime, namely a reporting effect, a matching effect on potential offenders and victims, and a direct effect on crime propensity. Our results indicate that the direct effect is non-negligible and positive, plausibly as a result of increased consumption of pornography.
How big is the effect?
A 1 percentage point increase in internet use is associated with an increase in rapes of 0.14 and an increase in child sex abuse of 0.16, per 100,000 inhabitants. The effects on the overall sex crime rate and rapes are precisely estimated, being statistically significant at the 5%-level.
How much is this? A 1% change in internet use seems uninteresting. Perhaps we should multiply by 50? A 50% increase in internet use (which is roughly what was observed in Norway, according to one of the graphs) is associated in their fitted model with an increase in rapes of 7 per 100,000 and in increase in child sex abuse of 8 per 100,000.
How big are these numbers? According to Figure 4, the overall rate of rape is about 15 per 100,000 and the overall rate of child sex abuse is about 25 per 100,000. So, unless I’m missing something here, the estimate is that about half the rapes and one-third of the child sex abuse are caused by the internet.
(Figures 2-4 confused me at first because the time axes are on different scales.)
I don’t have it in me to try to evaluate this paper in detail. But what I really want to see here is a scatterplot. I want to see what the data say: where is the leverage coming from? Presumably the sex crimes rates are increasing faster in certain cities than others, coinciding to some extent with internet coverage. I’d just like to see the basic pattern to understand where the conclusions are coming from. A scatterplot is not the end of the analysis but it would be a good beginning.
I’d also like to see a more direct analysis to go along with the instrumental variable model. You can think of the instrument has having a joint effect on the intermediate and final outcomes.
Finally, the seriousness of the topic aside, I can’t helped but be amused by the authors’ use of econ-jargon. As everybody knows, in an applied micro paper you can’t just run the regression and give your results, you have to start with a theoretical model. Which in this case begins with, “For a crime to happen, we need (at least) two individuals meeting each other.” What about burglary??
On the next page we see the delightful expression “dp/dporn,” which actually looks even better in real life because the d’s are those curly partial-derivative d’s and the first p is a rho. OK, here’s the full version; read it and weep:
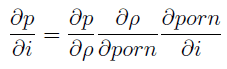
Also, “most of what we know about dp/dporn is either circumstantial or anecdotal.”
All this theory doesn’t really hurt any, but I think it all comes down to the data analysis.
"The effects on the overall sex crime rate and rapes are precisely estimated, being statistically significant at the 5%-level."
Isn't that a little like saying: this dinner is nutritious, being tasty? What has one to do with the other? it's true that very, very untasty food is unlikely to be nutritius, given that it will be almost impossible to swallow. The same is true of insignificant results — they're hard to swallow. But tastiness > nutritious. In fact, the regression coefficients I glanced at aren't very precisely measured at all. The effect could be almost twice Andrew's estimated effect, or fairly close to zero.
I have a big problem with the last sentence of the quote. Specifically, "plausibly as a result of increased consumption of pornography." I haven't read the paper, so I don't know how they back this up, but at first glance it sounds a lot like the old "violent movies make people do violent acts" myth.
Check page 32, figure 4. This shows that the effect of the internet is modest, and it's still safe to visit Norway.
I don't find an effect of that size incredible.
Zbicylist:
I agree the total numbers are low, but still: if the internet really doubled the number of rapes in a country, that's a big deal, no?
I've learnt from experience not to expect scatterplots from econometricians, though I've never understood why. One of their standard graduate-level texts, Wooldridge's 'Econometric Analysis of Cross Section and Panel Data', doesn't contain a single plot on any of its 752 pages. Are plots beneath them? Are they worried about data snooping? Perhaps someone can explain.
Gabriel: I was irked by that sentence too. It's what I call "story time!" It's that moment that the analyst turns away from the data. Tellingly, they use the word "plausibly": to whom?
I agree with Andrew here. The question may not be that the estimated effects are too small to be meaningful; it could be that they are much too large to be sensible.
Also, do they do a sensitivity analysis of their dp/dporn estimate since it's "circumstantial or anecdotal"?
RogerH: Sample size one, but for an abstract on plot (guess which) with an economist colleague
They asked me to change "plots" to "methods and graphs". Plots just did not seem very academic.
Also they are a lot of work, especially when colour is discouraged and the journal has _standards_.
And dreadfully hard to give clear fully defensible descriptions of what _should be_ noticed in them.
K?
I think with econometricians and applied economists (I am not one, but count many as friends) there appear to be a mix of key issues, although I am not clear that they are often or indeed ever all spelled out. At least part of the issue is that not graphing, or graphing rarely, appears to be part of the culture almost from the first econometric course on. I'll phrase the issues that spring to mind starkly without wanting to seem hostile to either species — and indeed in the hope of eliciting some reasoned replies from such people.
1. There is a guild bias towards testing every assumption formally, which is tied up with a ritual of emphasising tables of coefficients, standard errors and t statistics in publications. Graphical assessment seems far too arbitrary or subjective by comparison. Or, there's no space for graphs once the testosterone stuff of equations and tables has been displayed.
2. Most models worth discussing have numerous complicating features, e.g. many predictors, instrumental variables, fancy assumptions about error processes, so the argument seems to be: what is the corresponding plot? The implication is that most practice has left one y, one x and a scatter plot a long way behind in Stats 100.
3. Quite a lot of work is currently for categorical or limited dependent variables where the best kind of graphics is often difficult to determine.
4. Often now sample sizes are enormous (e.g. finance data, massive surveys) so that many graphs would be overwhelming.
5. It's imitative. People do what other people do. There is an imperative to demonstrate rigour, which rules out the exploratory style of graphics and relaxed speculation out of court. Error belongs in the model and doubt is directed at other economists.
Naturally I know that there are answers to all these, but these are the attitudes I sometimes detect.