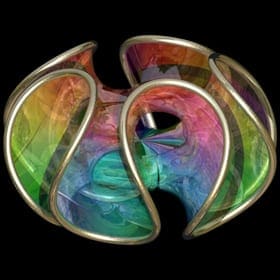
Mojca has pointed me to Paul Nylander’s visualizations. He’s using raytracing software and Mathematica to create pieces of visualization art:

I tried looking for examples that could be useful in the usual statistical practice, and his example of Horseshoe magnetic fields demonstrates distributions on a surface:
 |
 |