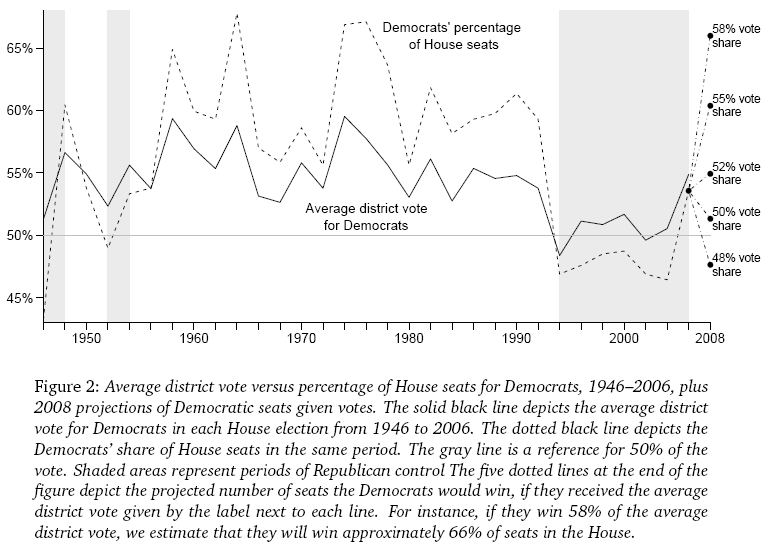
We’ll have to wait until we’ve had a chance to analyze all the election returns, but so far the Democrats appear to have won 59% of the House seats, which according to the recent article by Kastellec, Chandler, and myself, suggests that Democratic House candidates averaged about 54% of the two-party vote.
Historically, both these numbers are pretty strong, bringing the Democrats to something near their position in the 1980s, and doing quite a bit better than the Republicans in 1994:
In particular, the Democrats did about as well, on average, in the House, as Obama did in the presidential tally. I haven’t yet looked at the numbers but I suspect that something similar happened with the Senate: even after just missing a few Senate seats at 51/49 and 52/48 margins, the Democrats still picked up a few.
The next thing to see is where the vote was changing; based on what’s happened before, my guess is approximate uniform swing.
If you mean that there is a functional connection between % of seats and % of popular votes, yes that is demonstrated mathematically in the late Henri Theil’s book “Econometrics and Information Theory”.
Mathematical theory is great; so is empirical work. I never met the late Henri Theil but I’d like to think he would’ve been happy to see empirical estimates of the seats-votes curve. The point of our paper is not to say that such a curve exists but to estimate what it is.