Two interesting articles in Newsweek: Jon Meacham writes that “America remains a center-right nation,” and Jonathan Alter replies that “we’re heading left once again.” Here’s Meacham:
So are we a centrist country, or a right-of-center one? I think the latter, because the mean to which most Americans revert tends to be more conservative than liberal. . . . nearly twice as many people call themselves conservatives as liberals (40 percent to 20 percent), and Republicans have dominated presidential politics—in many ways the most personal, visceral vote we cast—for 40 years. Since 1968, Democrats have won only three of 10 general elections (1976, 1992 and 1996). . . . In California, at least one poll suggests that social conservatives may pass an anti-gay-marriage ballot proposition next month . . .
And here’s Alter:
Jon Meacham is right that by the standards of a European-style welfare state, we will always be a relatively conservative country. But closer to home, the norm has not been consistently conservative over the course of the 20th century. If anything, the nation was more often center-left. Democrats controlled the House of Representatives—the “People’s House”—for six straight decades between 1930 and 1994 (with only a short exception). While many were Southern conservatives on race, the huge chunks of progressive legislation they swallowed over many years could choke an elephant. . . .
A methodological comment
And now here’s me. Before getting to the data on voters’ ideologies, let me make a brief methodological comment. Meacham’s point that Republicans have been winning presidential elections is relevant; in fact, before 1994 there was an ongoing discussion within political science as to how the Republicans were consistently winning the presidency while being in the minority in party identification and congressional voting. (From 1994-2004, the two parties split the congressional vote roughly evenly. From 1950-1992 and again in 2006 (and probably in 2008 as well), it’s been a pretty consistent 55% for Dems and 45% for Reps. See the lower graph at this link.) So, yes. But Meacham’s comparison is misleading in that he’s treating the election outcomes as yes/no measures of public opinion. But surely if the essentially-tied 1968, 1976, and 2000 elections tell us anything about public opinion, it is that it was evenly divided in these years, not that America was left or right. Counting the winner is a common mistake people make in studying elections. Yes, for policy concerns it is the winner that matters more than the vote margin, but for studying public opinion it is a different story.
A more important point, though, which both Meacham and Alter raise in different ways, is that ideology is relative to current standards; given that the parties can shift positions (if only gradually at times), it is no surprise that they find themselves not too far from current voters. For example, is it really a sign of conservatism that 50% of Californians think gay marriage is OK? Similarly, if Obama raises the tax rate on the top bracket to 40%, would this really represent a triumph of liberalism? The center has moved a lot, in different ways, over the past few decades.
And now for some data
From Michael Herron and Joe Bafumi (and in chapter 8 of our book), here are estimates of the distributions of voters, House members, and senators on a common scale:

House members and senators’ positions are estimated based on their votes in Congress. Voters’ positions are estimated based on some survey questions where people were asked their views on a number of issues that had also been voted on in Congress. As you can see, elected representatives are generally more extreme than voters. (See here for versions of the above graph broken down by red, purple, and blue states.)
In light of recent American politics, this pattern makes sense: congressmembers generally vote with their parties, very few conservative Democrats and liberal Republicans remain in the House or the Senate, and, as Delia and I have shown, voters’ positions on issues are much more of a mixed bag. Voters may be to the left of the Democratic party or to the right of the Republican party on specific issues, but, on the whole, most voters don’t have that sort of ideological consistency.
More data on voters’ ideologies, this time in comparison to how they perceive Bush and Kerry, is in chapter 9 of our book, originally from my paper with Jeff Cai. Here’s the graph showing how a random sample of a thousand or so Americans in October, 2004, perceived Bush, Kerry, and themselves on a set of economic and social issues (i.e., respondents were asked about particular issues, not about general “liberal” or “conservative” labels):
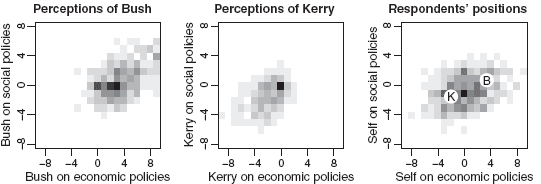
There was a lot of spread; on average, though, voters saw themselves as between the two candidates. (See the graph on the right, in which K and B represent respondents’ average assessments of where Bush and Kerry stood on these issues.)
At the beginning of the year I had an exchange with an economist who interpreted the polls to say that American opinion is to the left of the middle of the Democratic party. His point was that, although Americans are much more likely to label themselves as conservative than liberal, but they are more liberal when you look at particular issues such as health insurance and whether the rich pay too little in taxes. When you look at a large basket of issues, however, you find the voters to be between the two parties, as is indicated in our graphs above.
Voters and nonvoters
Finally, we should distinguish between political positions of voters and of Americans in general. As Nagler and Leighley have discussed, nonvoters differ systematically from voters:
The ideological distribution of voters and non-voters in 2004 is fairly similar to that in 1972: moderates are most under-represented, while conservatives are over-represented. Importantly, the magnitude of these differences increases between 1972 and 2004. . . . these differences on class-based issues are enduring and increasing.
For the question, What should President Obama (or McCain) do?, the opinions of nonvoters aren’t so relevant. But for statements about America, compared to other countries with higher voter turnout, it’s worth keeping these differences in mind.
In conclusion
Both Meacham and Alter have useful perspectives on recent American political history, and the data we’ve looked at don’t directly address the “center-right” vs. “center-left” controversy: these terms only make sense when compared to some contemporary standard. But the evidence, both from elections and from polls, supports the commonsensical idea that the two major parties are far enough apart that, at least in the short term, voters can move policy as far as they want to the left or to the right by consistently voting for Democrats or Republicans. Either party, when elected, has to balance its policy goals with its desire not to move too far away from the center.
That said, the success of an administrative policy depends on more than where it stands on a left-right scale. For example, when it came to implementing conservative policies, Reagan had more success with tax cuts than with budget cuts.
I also wrote a piece on the “center-right” issue over the weekend:
http://www.dailykos.com/storyonly/2008/10/18/14164/549/31/634595
Pingback: Matthew Yglesias » Congress Matters
Two related questions: Do there exist in the American electorate two sets of highly correlated policy positions that we could really label “left” and “right,” and to what degree do the party platforms correspond to those sets of policy positions?
Weighting of positions seems very important; Catholic voters might generally hold a very leftist set of positions, then vote Republican over abortion, and a lot of conservatives seem to be very uncomfortable with Republican budgeting, but it has taken some truly mammoth deficits to see any of them vote Democrat.
My own very unscientific sense is that very few Americans feel completely comfortable with the major planks in either party’s platform, and that most people are neither “left” nor “right” in our current notions of the words, nor even center (in the sense of supporting compromises between left and right positions) but are instead pragmatic — picking positions that range from hard left (“Strong protection for constitutional rights…”, “Universal health care…”) to hard right (“…including the Second Amendment!” “…and an end to abortion!”). What does the data say?
Please excuse me if the answer is “read the book.” :)
I would say most of us as individuals hold both conservative and liberal positions. I’m socially liberal, economically conservative. I’m actually registered libertarian for this reason.
I have no idea what you are talking about, since we are evidently a conservative nation as any person with eyes can see if they look. I look. do you?
Alan, Phil, Donna: I think all of you are picking up on the ideological incoherence of Americans. As I noted above, ideological coherence is much more relevant to legislators (who, among other things, want to pass laws that make sense) than to voters. More specifically:
Alan: Yes, I can believe that the center of gravity has changed in recent years. It’ll be interesting to check back in 2012 on some of these trends.
Phil: I’d love for you to buy our book and read chapter 8, but actually a lot of the numbers to answer your question are in my paper with Delia linked to above. Although we didn’t actually do a Catholic/Protestant breakdown.
Donna: As you can see from the graph above, “socially liberal and economically conservative” is a minority position but you’re certainly not alone. I completely agree that the two parties simply can’t represent everyone.
Anne: Looking with your eyes is useful but it’s only giving you local information. Statistics give you a big picture. Neither quantitative nor qualitative evidence is enough on its own. In addition, I have a blind colleague and we’ve been talking about developing improved statistical methods that allow people to visualize data without using their eyes.
“That said, the success of an administrative policy depends on more than where it stands on a left-right scale. For example, when it came to implementing conservative policies, Reagan had more success with tax cuts than with budget cuts.”
That view reflects a rather myopic fiscal perspective. If one defines budget balance as: PV of exhaustive spending ? {(assets – debts) + PV (taxes – transfers)}, where PV denotes the present value of a cash flow, the SSI reforms carried out under the Reagan administration were highly fiscally conservative, although entirely on the revenue side. The kicker in this analysis is that the 1986 Tax Reform, which was intended to be revenue neutral, greatly and largely inadvertently reduced taxes on folks who own very lucrative ‘small’ businesses.
The way I see the chart we are slightly more a Center Left nation, much less extreme than our parties. As Left-Right are multi-dimensional, I wonder if the details are in your book, so that I could see if the same distribution stands for Social issues, Economic issues, Foreign-Affairs issues.
I’d also like to see the raw statistics on these graphs as well on the individual questions that you used to derive them, and will buy the book if they are in it.
=====================
Finally, re: “Should the Democrats move to the left on economic policy?”, I sense that such studies don’t consider either the primaries or the voter turnout. I understand the tenancy to move toward the median, but the problems I see are:
1) Candidates are selected in the primaries, and the primary voters tend to vote their heart, thus there is a cost for the “extreme” candidate to flip-flop when they run for the election. Thus even if they would benefit by being close to the median, the lose by moving.
2) Though a candidate would pick up people who would prefer them by moving toward the median, they would lose the intensity of the people who they are moving away from. This means that as they move away from their base they loose their precinct workers and even some of their base voters who say, “If the candidate are not going to be be true Blue/Red, to the hell on both of them” .. My thought is if the voter turnout is also dependent on the closeness of the candidate to the voter, then the candidate has more reason to stay closer to their base.