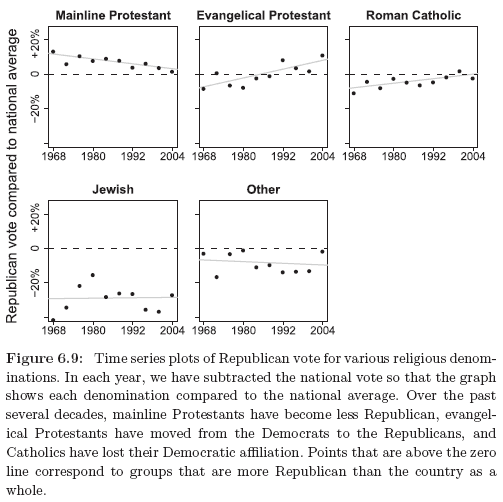
From our forthcoming Red State, Blue State book, here are some data going back to 1968 (from the National Election Study) on the voting patterns of different religious groups:
Perhaps also of interest is how this relates to religious attendance. More frequent attenders are more likely to vote Republican, but the pattern varies by denomination. Here’s what was happening in 2004 (as estimated from the Annenberg pre-election survey):
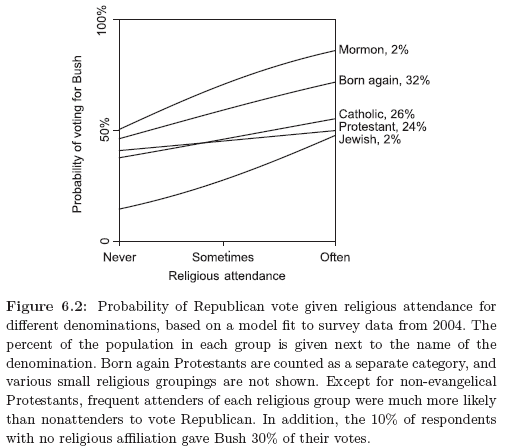
The graph for 2000 looks similar except that the line for Jews was flat in that year (maybe just a small-sample thing, I don’t know that I’d take it too seriously).