Mark Levy pointed me to this. I don’t know anything about this area of research, but if true, it’s just an amazing, amazing example of the importance of measurement error:
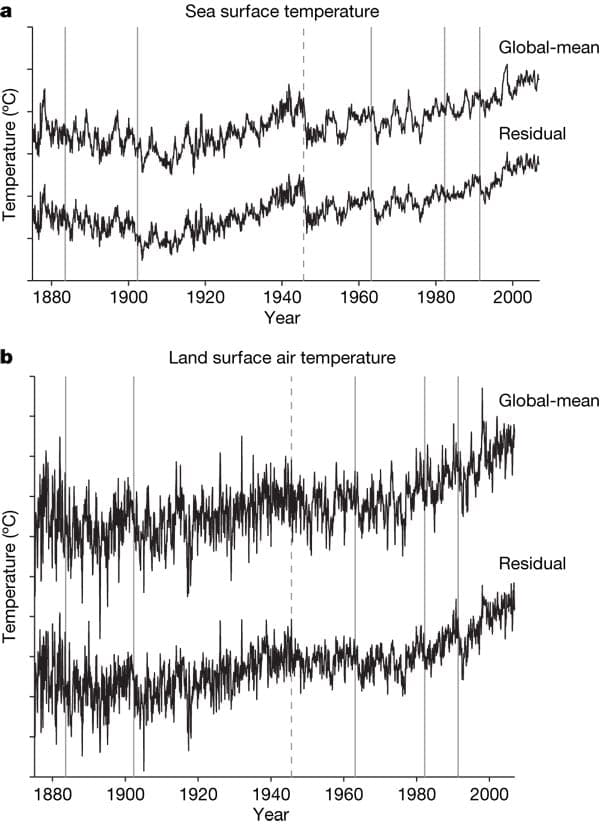
The 20th century warming trend is not a linear affair. The iconic climate curve, a combination of observed land and ocean temperatures, has quite a few ups and downs, most of which climate scientists can easily associate with natural phenomena such as large volcanic eruptions or El Nino events.
But one such peak has confused them a hell of a lot. The sharp drop in 1945 by around 0.3 °C – no less than 40% of the century-long upward trend in global mean temperature – seemed inexplicable. There was no major eruption at the time, nor is anything known of a massive El Nino that could have caused the abrupt drop in sea surface temperatures. The nuclear explosions over Hiroshima and Nagasaki are estimated to have had little effect on global mean temperature. Besides, the drop is only apparent in ocean data, but not in land measurements.
Now scientists have found – not without relief – that they have been fooled by a mirage.
The mysterious post-war ocean cooling is a glitch, a US-British team reports in a paper in this week’s Nature. What most climate researchers were convinced was real is in fact “the result of uncorrected instrumental biases in the sea surface temperature record,” they write. Here is an editor’s summary.
How come? Almost all sea temperature measurements during the Second World War were from US ships. The US crews measured the temperature of the water before it was used to cool the ships engine. When the war was over, British ships resumed their own measurements, but unlike the Americans they measured the temperature of water collected with ordinary buckets. Wind blowing past the buckets as they were hauled on board slightly cooled the water samples. The 1945 temperature drop is nothing else than the result of the sudden but uncorrected change from warm US measurements to cooler UK measurements, the team found.
Whaaa…?
The article (by Quirin Schiermeier) continues:
That’s a rather trivial explanation for a long-standing conundrum, so why has it taken so long to find out? Because identifying the glitch was less simple than it might appear, says David Thompson of the State University of Colorado in Boulder. The now digitized logbooks of neither US nor British ships contain any information on how the sea surface temperature measurements were taken, he says. Only when consulting maritime historians it occurred to him where to search for the source of the faintly suspected bias. Our news story here has more.
Scientists can now correct for the overlooked discontinuity, which will alter the character of mid-twentieth century temperature variability. In a News and Views article here (subscription required) Chris Forest and Richard Reynolds lay out why this will not affect conclusions about an overall 20th century warming trend.
And there’s more:
But it may not be the last uncorrected instrument bias in the record. The increasing number of measurements from automated buoys, which in the 1970s begun to replace ship-based measurements, has potentially led to an underestimation of recent sea surface temperature warming.
Part of me thinks that's really elegant. Remove the pattern you understand from the data. Then find a subset – first sea data, then data from US ships – which contains as much of the residual you're trying to understand as you can, until you can find the cause of the anomaly. And once that's achieved, adjust the raw data to remove the error.
But part of me is absolutely terrified. You're – almost – tweaking the data to fit your theory. The only thing you're going to do in the long run is push the data closer to your hypothesis. This method won't find errors in your favour, so you're just going to improve fit. Now perhaps it took so long to identify because it was a tricky conundrum. But perhaps it took so long for the same reason you have to deal a lot of poker hands before you get a royal flush. If you're comparing two sets of data and the explanatory variables you look at are only limited by your imagination, you'll find something eventually.
I'm not trying to be critical of these researchers here. Most statistical theory assumes you decided how you were going to collect your numbers, that the numbers mean what they're supposed to, and then performs various manipulations on it. But plenty of analysis is of scrappy pieces of bolted-together and adjusted data like this. And there's not much guidance on how to deal with departures from the ideal. There's a real difference between the theory and what people have to do in practice.
Alex,
I agree–this is a real concern, and it comes up in just about every research project I've ever been involved in.
A clarificatory question — is it standard practice in statistics to call this "measurement" error? Because we (astronomers) would call this an instance of systematic error, whereas measurement error is more like data variance, i.e., like sqrt(N) when N events are detected.
Andrew: Good point. Part of the concern is empirically addressable: replicate the conditions you postulate and confirm that the different measurement methods do produce differences consistent with what you observed in the actual data.
It's a tougher problem that we only tend to look for errors in data we don't like. I've run into this many times in my own work. I don't remember the details, but I have seen a method used in meta-analyses that addresses a similar problem: papers that confirm an effect get published, while papers that do not confirm it get filed away and are not analyzed. If you're really looking at a fair sample of studies, you should see your observed effects forming a normal distribution around some mean value. If you're seeing a big file-drawer effect, then you'll see a lot of observations at the low end, followed by a sudden drop-off right where you'd be going above p=.05. In the current case, you'd want to see the identification of errors in the climate record result in approximately equal numbers of warming and cooling adjustments. Unfortunately, there's only one climate record and only so many adjustments to be made, so even a strong preponderance of warming adjustments isn't too far from chance. But that's the general problem with climate science — the stakes are high, the data are inadequate for really good prediction, and there's no way to generate more.
HI,
we should also remember the ozone hole story, where as I recall the NASA scientists detrended their data, whereas the BAS scientists didn't.
Looking for wht you don't know is so hard…
Dave
I don't know what ozone hole story DaveG has in mind, but there is an urban myth that NASA threw out outliers because they didn't believe them, where BAS [British Antarctic Survey] did believe in them.
There seems no real substance to that story. The BAS scientists did great work, but the NASA people weren't being stupid.
Friedrich Pukelsheim had a very nice letter on this in 1990:
Robustness of statistical gossip and the Antarctic ozone hole. Institute of Mathematical Statistics Bulletin 19: 540-542.
That is accessible to all from
but has had no detectable impact on the circulation of that story.
James Annan has some discussion of the possible impacts of correcting this bias.
Missing URL:
http://www.math.uni-augsburg.de/stochastik/pukels…
WOW.
I looked at the pdf which seems very convincing.
I must admit the version I had heard was not blaming robust statistics. Verily a corbelled meme!
Dave