This is pretty embarrassing, but I think it’s better to tell all, if for no other reason than to make others aware of the challenges of working with data . . .
OK, so we’re reanalyzing some data from the Comparative Study of Electoral Systems, basically replicating some findings of Huber and Stanig but including additional countries and with some slightly different coding of political parties.
We have two key graphs.
First, for each country, we compute the difference between rich and poor in voting for the conservative party or parties. This graph (not shown here) reveals that the rich-poor gap in the United States is larger than most of the other (mostly European) countries in the sample.
For our second graph, we fit a model predicting conservative vote given income and religious attendance. For each country, the three lines show estimated conservative vote (compared to the national average) as a function of individual income, among people who attend religious services frequently (solid line), occasionally (light line), and never (dashed line).
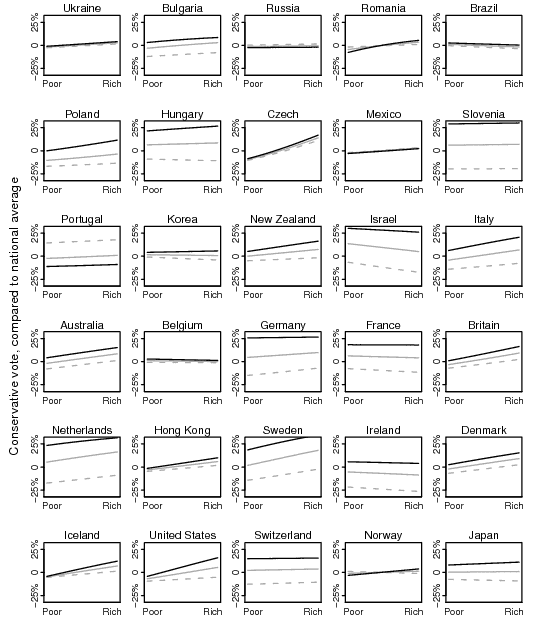
The countries are ordered by increasing per-capita GDP. On the bottom line is the United States, with its familiar pattern of religious attendance mattering more for the rich than the poor. As you can see, religious people vote for conservative parties in many countries–Americans are far from unique in that way.
Wha…?
But whassup with Portugal? The only country where the religious vote in a less conservative way than the secular–the lines go in the wrong order! We asked some experts what was going on, and we were told that the center-left Socialist Party and the center-right Social Democratic Party seem to be resistant to the direction or degree of religiosity, and that the party competition in Portugal is basically non-ideological.
But, then, why the big difference between religious and secular in our data? Well, we were also told that the data for Portugal are probably crappy. So we figured we’d just remove Portugal from our graph and add a note why we excluded it, based on concerns about data and some comments about the party structure there. Put then we looked at the data again . . .
It turned out the problem was in the name of one party (the Popular Party)–it had an extra comma in its name and when we read in the data, we mistakenly counted it as a different party. Whoops! (Or, as Mezzanine-era Nicholson Baker would say, Whoop!)
Here’s the corrected figure:
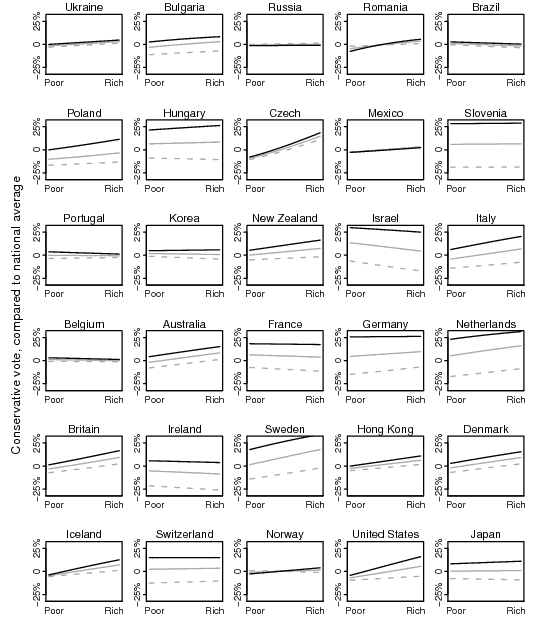
Yeah, yeah, I know, we better check all the party names carefully now.
P.S. I guess we could make the case that we were being Bayesian, in checking the results that contradicted our prior distribution. In this case, the prior wasn’t really that religion always is associated with conservative voting, but rather that the countries followed some smooth distribution. Actually, when I first noticed the problem with Portugal, I assumed the data were ok and that there was some Portugal-specific story, perhaps a left-wing church-based party. (Yes, I’m sure that comment reveals my ignorance of Portugal, but that’s the point here.) I was looking for the magic x-variable that explained the unexplained variation. In this case, the x-factor was a coding error…
P.P.S. More here.
What about Israel?
It seems to be the only one where the rich vote more liberally than the poor. But, with so many parties there, I'm curious as to how you rank them.
I think this illustrates a common problem with data analysis: Suspicious results get double-checked more often. Yes, you can call it Bayesian, but it still biases the analysis in favour of unsuspicious results (which are less likely to get double-checked).
(Don't get me wrong, I'm not blaming you here. I still remember quite vividly the afternoon I discovered that all our previous analysis were plain wrong because we had forgotten to recode some of the missings as zeros – and that was two days before the report was due. I came into the office at six in the morning the next day and then the computers didn's work – but that's another story.)
What's the matter with the GDP/capita order?
Peter, Israel, Ireland, Portugal and Brazil have the same pattern for the rich.
Lemmus^2: can call this "narrative bias" or "optimism bias". that's why Andrew said "we better check all the party names carefully now".
You might also consider that a small compensation for the publication bias that favours "exciting new results".