In Graphics of Large Datasets: Visualizing a Million (about which more in a future entry), I saw the following graph reproduced from an 1869 book by Francis Galton, one of the fathers of applied statistics:
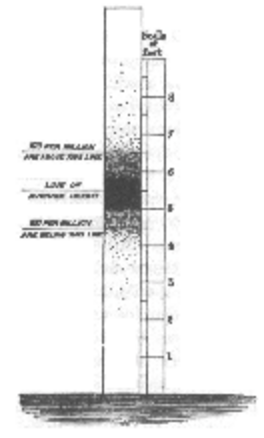
According to this graph [sorry it’s hard to read: the words on the left say “100 per million above this line”, “Line of average height”, and “100 per millon above this line”; and on the right it says “Scale of feet”], one man in a million should be 9 feet tall! This didn’t make sense to me: if there were about 10 million men in England in Galton’s time, this would lead us to expect 10 nine-footers. As far as I know, this didn’t happen, and I assume Galton would’ve realized this when he was making the graph.
I asked Antony Unwin (author of the chapter that included the above graph), Howard Wainer (expert on statistical graphics) and Steve Stigler (expert on the history of statistics). Howard said that the tallest man ever was almost 9 feet. Certainly a rate of less than 1 in a million.
Antony wrote:
Galton was postulating a hypothetical population with a normal distribution. . . .He did investigate some physical distributions in the book (including the chest dimensions of Scottish soldiers) and claimed (p32 included in the attached) that: “It will now be my aim to show there is sufficient uniformity in the inhabitants of the British Isles to bring them fairly within the grasp of this law.” So he should have thought about the extreme values. On the other hand information in those days ways not so readily available as it is now. Might Galton have believed there were such people, he just hadn’t heard anything of them yet? The lower classes were not acknowledged and who knows what oddities might have been found amongst them? Forrest’s excellent biography of Galton ends with an anecdote that supports the idea of his not regarding all as equals.
Steve wrote:
Galton was describing a hypothetical population, and he specifies for the illustration that the mean is 66 inches and that 100/million exceed 78 inches. By my rough calculation that gives a SD of about 3.2 inches. This was his earliest statistical book and Galton had more faith in the normal than later, but without good tables available (even though Laplace had given a continued fraction that would have given acceptable results) Galton did not appreciate how fast the tail comes down at the extremes. His view might have been colored by the fact that in the 1850s he had spent a couple of years in Africa, where there were and still are peoples of a quite wide variety of heights.
Howard summarized:
We must calculate the z-score associated with a probability of 100 out of 1,000,000 to be above 78 inches. The z-score of 1/10,000 is 3.72 and so we calculate the standard deviation to be (78-66)/3.72=3.2. We then ask how many sd’s away from the mean is it for a nine-footer. The obvious calculation [(108-66)/3.2] yields a z-score of 13. If height were truly distributed normally, the likelihood of a nine-footer would be far, far less than one in a trillion.
This shows that (a) Galton in 1869 didn’t know the tails of the normal distribution (he couldn’t just use “pnorm” in R) and (b) actual distribution of men’s heights is longer-tailed than normal.
The interesting thing to me is point (a).
Howard will have a column on this in the next issue of Chance.
hmm. galton never meant much to me. did he appear on a stamp?
me: I don't know that most people would get your Public Enemy reference…
Hey, I'm just glad that anybody caught the reference…